
Every edge, in one suite.
Fifteen indicators across three premium suites, built to read momentum, structure, and trend the way institutional traders do. Browse what each one does before you subscribe.
MADALGO Pulse
Read momentum and volume the moment it shifts.
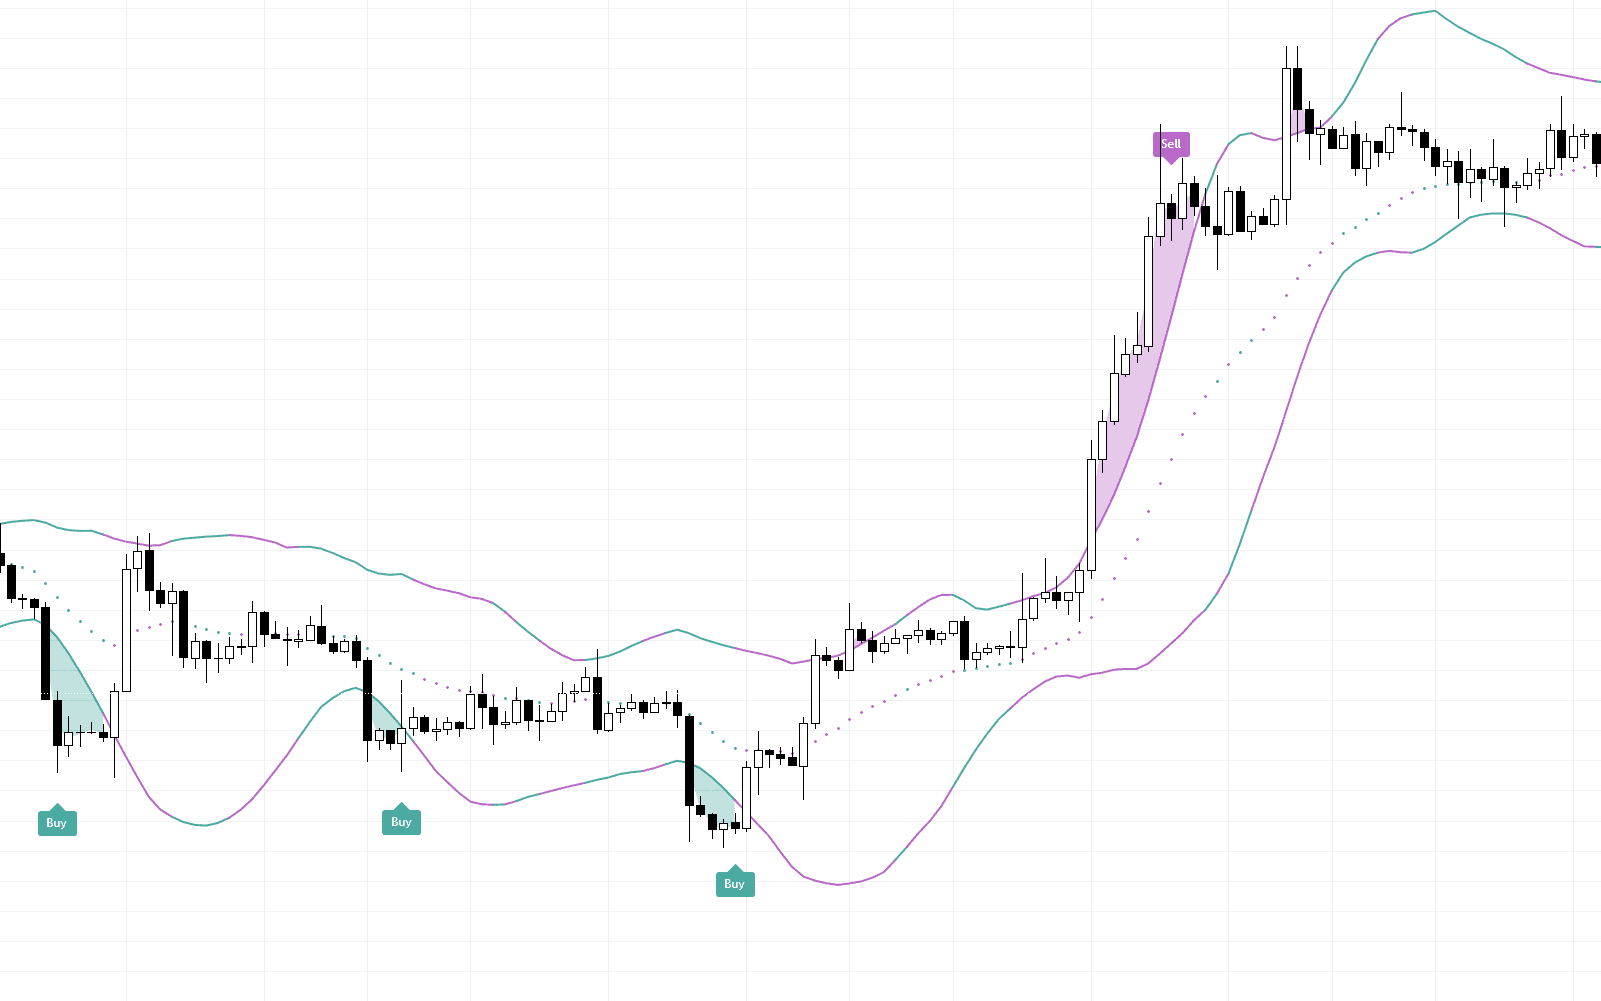
Profit Bands w/ Signals
Plots dynamic price bands with built-in buy/sell algorithms, shading overbought and oversold zones so you only get signals confirmed by price moving outside the bands.
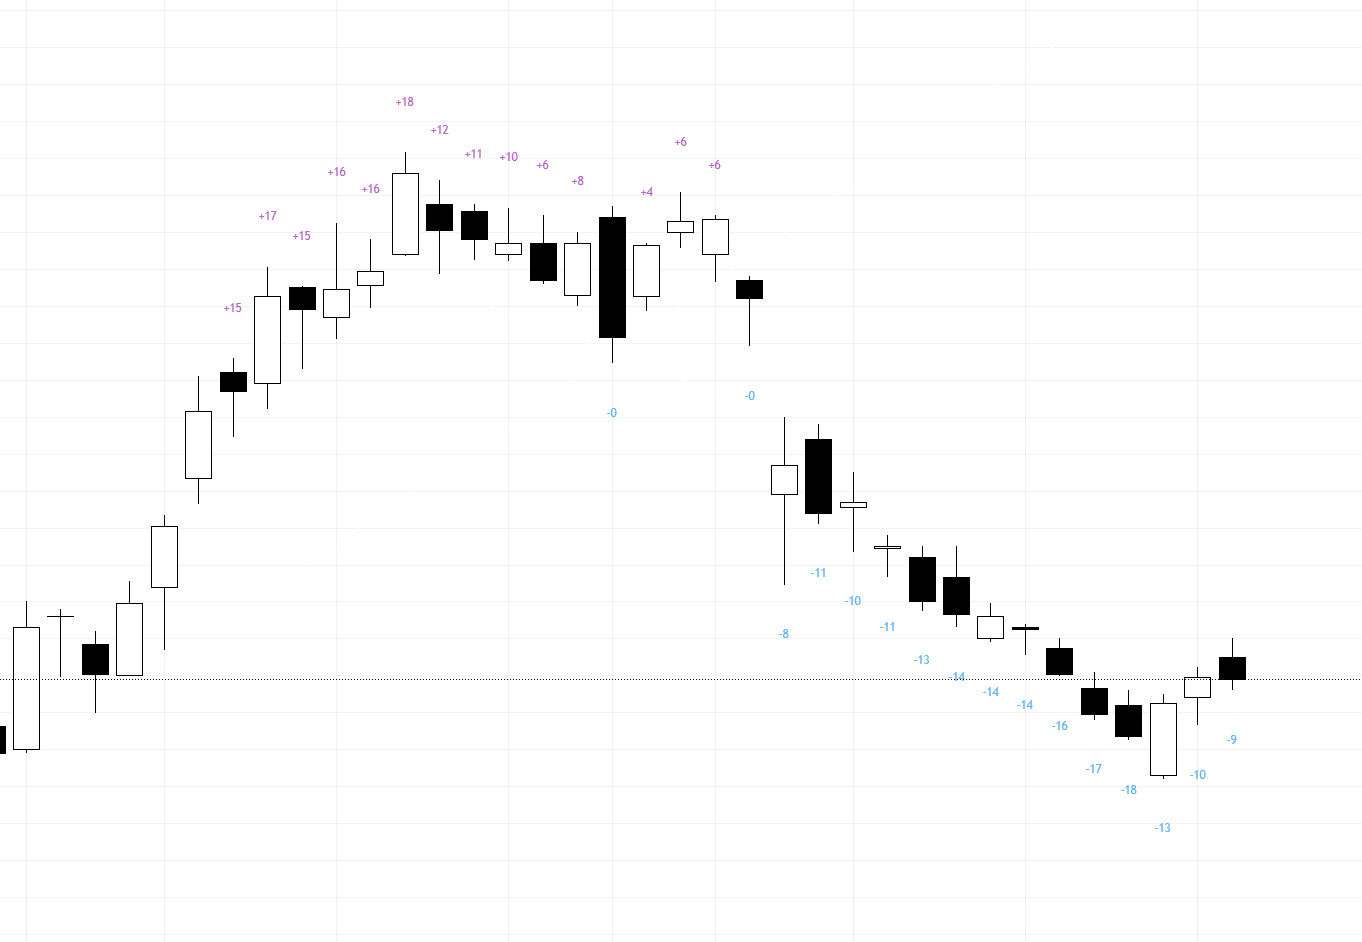
Volume-Weighted Strength Index
Blends price and volume into a dynamically rescaled strength reading displayed right on your candles, making bullish and bearish momentum easy to spot at a glance.
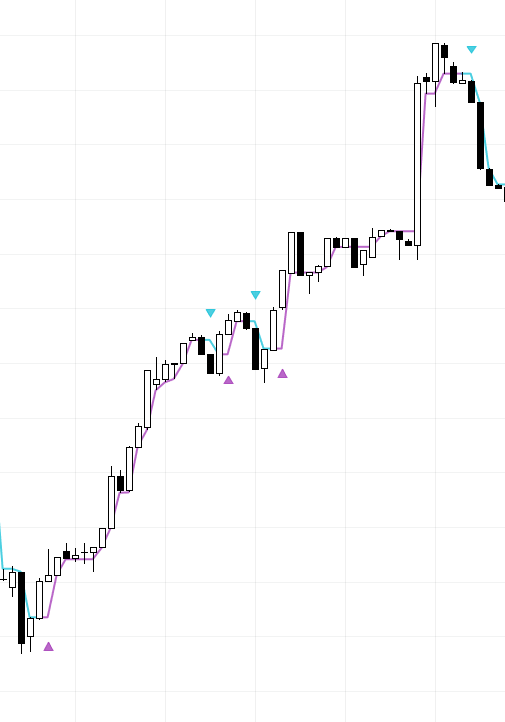
Hyper Trend
A responsive trend-following overlay that adapts to volatility and price action, flagging potential entries and exits with color-coded lines and buy/sell arrows.
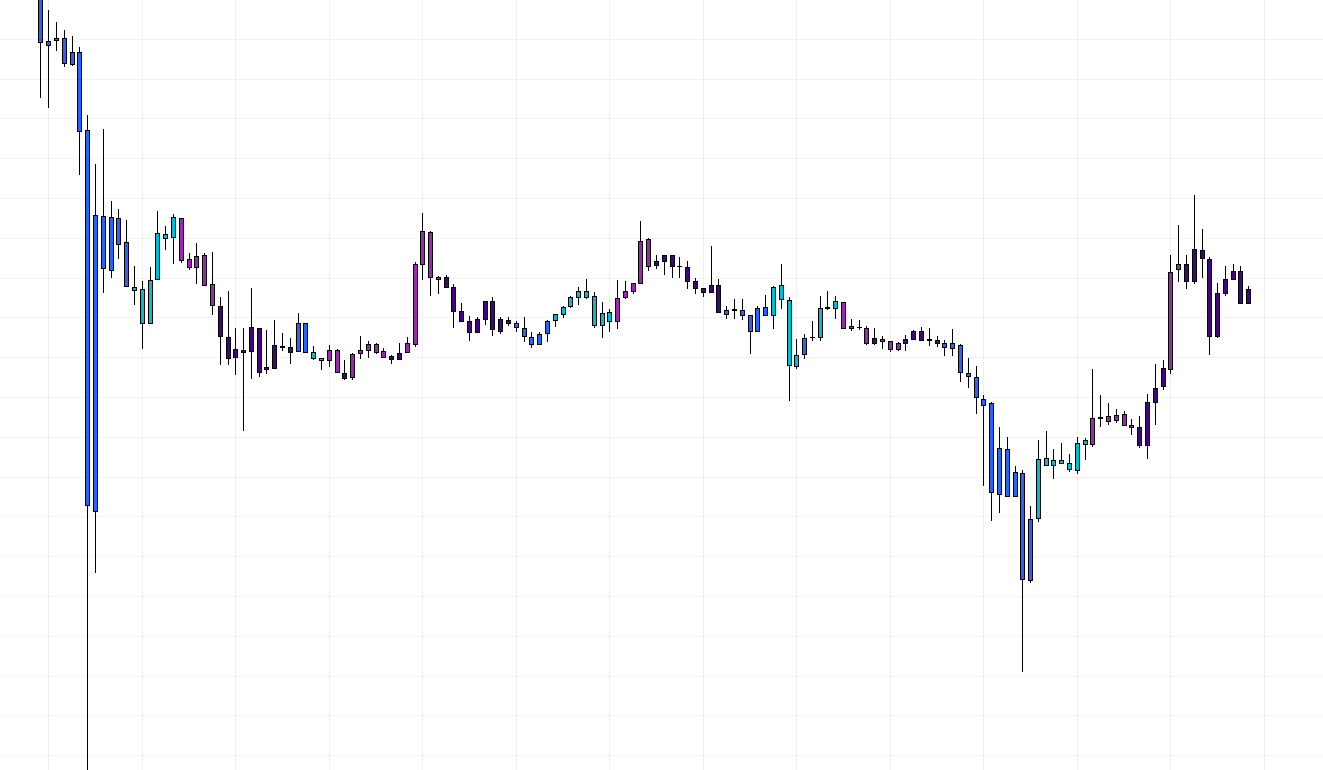
Trend Alert Candles
Colors your candles to flag trend exhaustion and continuation in real time, helping you spot reversals before the broader market catches on.
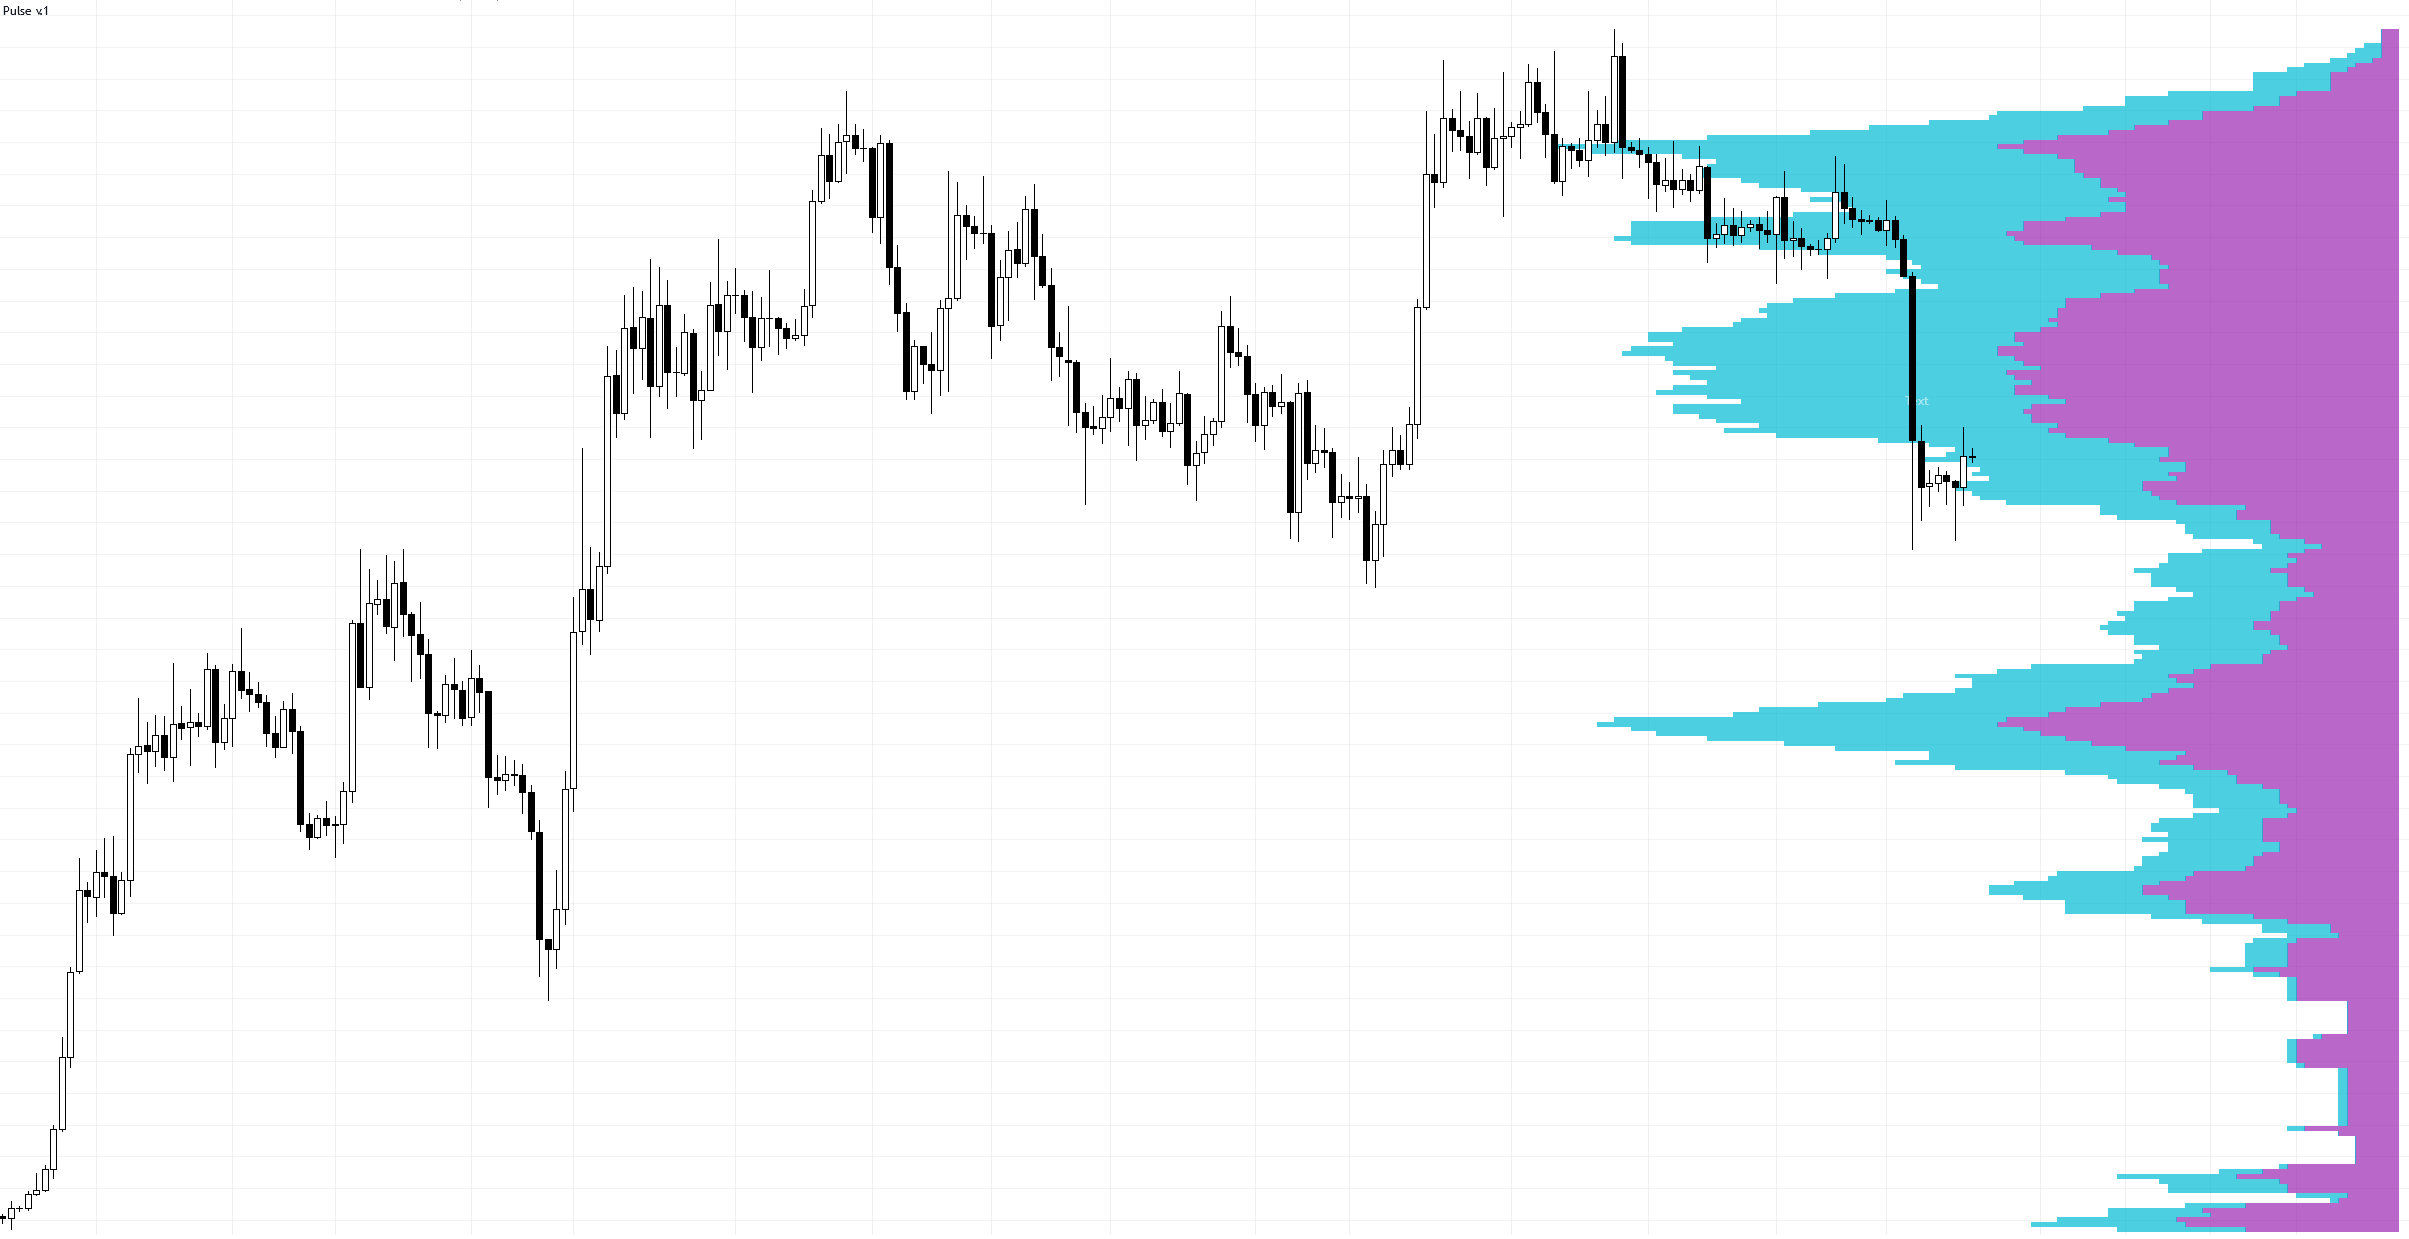
Volume Profile Pro
Visualizes volume distribution across price levels with fixed-range or visible-range histograms, revealing where buying and selling pressure is concentrated.
MADALGO Navigator
See where price is headed before the crowd does.
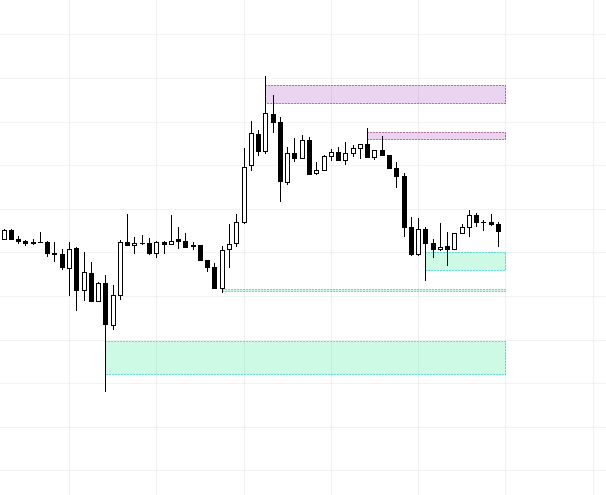
Institutional Liquidity Zones
Maps out price zones where large institutional players are likely trading, giving you a window into where the smart money may execute.
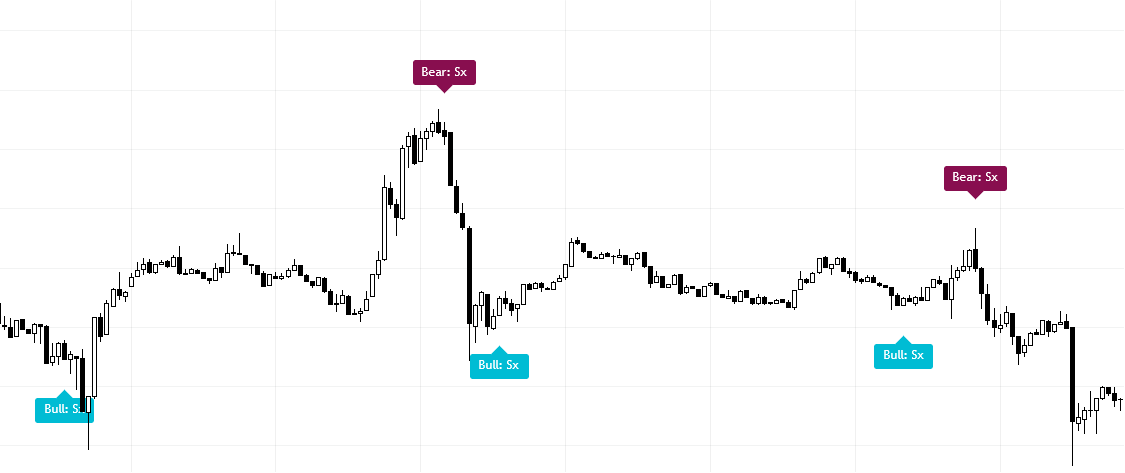
Divergence Detector
Automatically scans price against multiple custom oscillators to flag bullish and bearish divergences, surfacing early clues of a potential trend reversal.
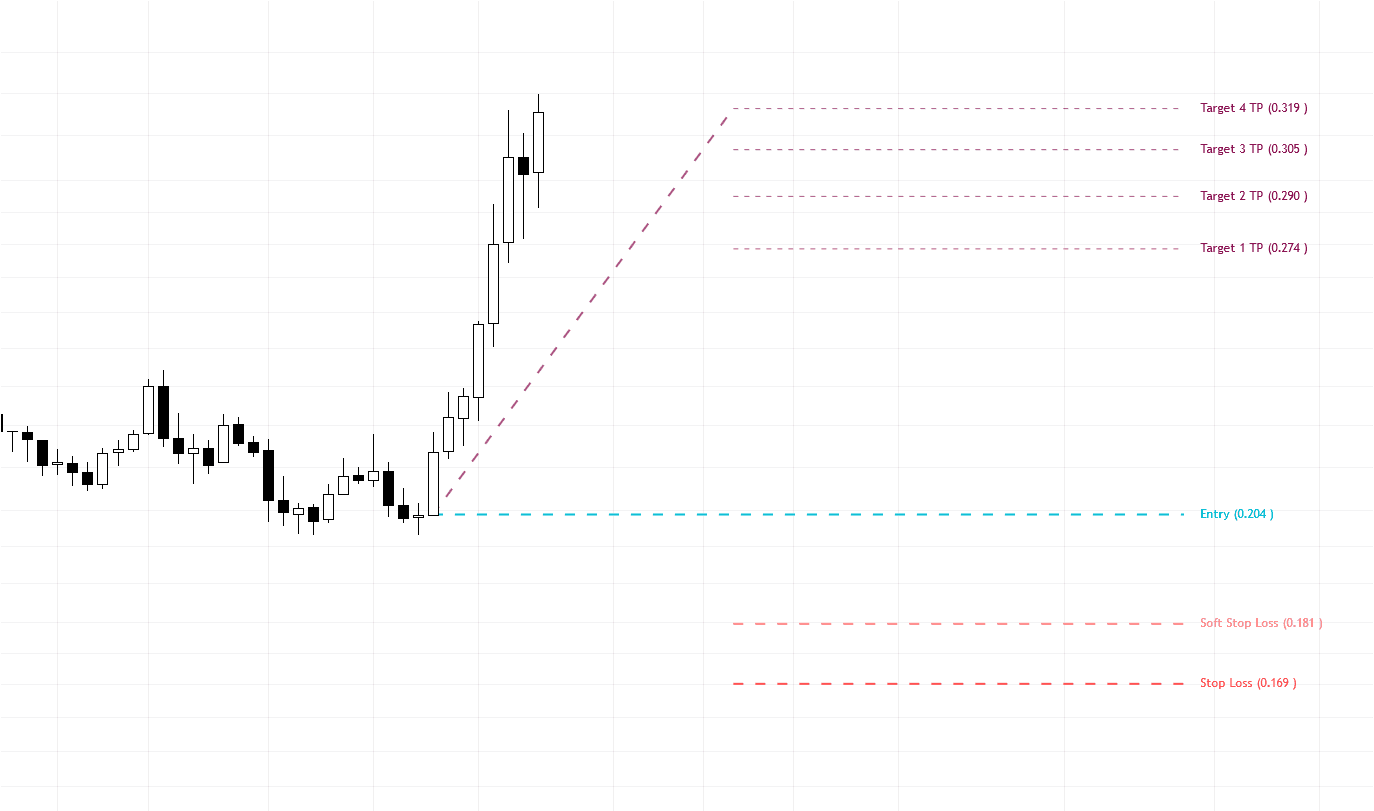
TargetScope
Auto-calculates entry, stop-loss, and target levels from aggregated visible price ranges, taking the guesswork out of setting up precise trades.
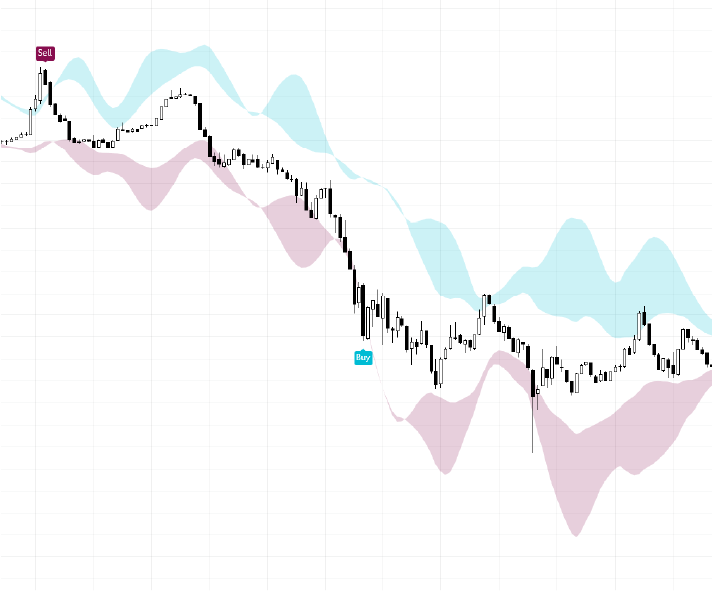
TrendShift Clouds
Plots cloud-like regions built from Keltner, Donchian, and Bollinger data to visually flag where the market trend may be about to shift.
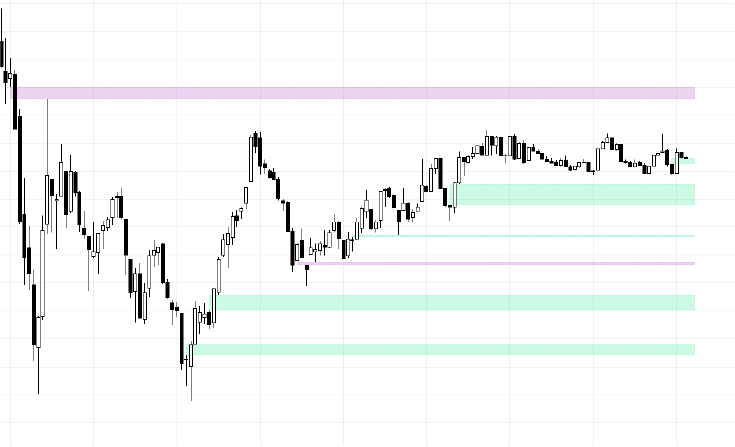
True Range FVG
Detects meaningful fair value gaps using price and volatility criteria, plotting them as colored boxes that highlight where price may be drawn back to.
MADALGO Dynamics
Filter noise and trade the trends that actually hold.
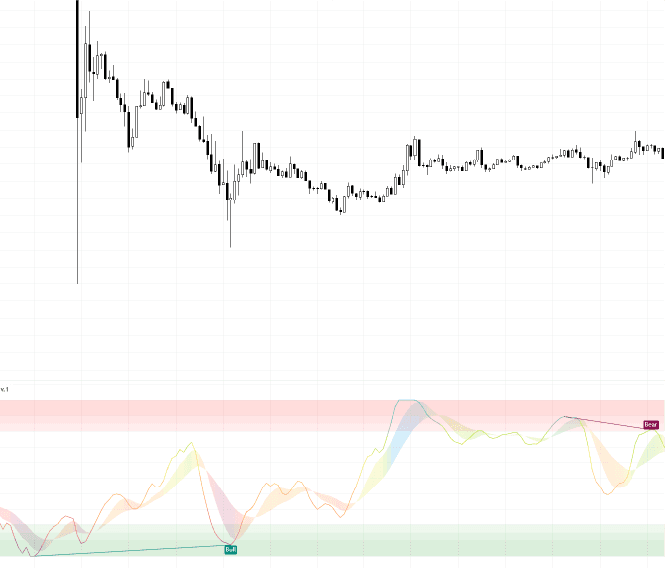
Institutional Money Flow
Tracks net volume from high-volume institutional players to build a trend-following oscillator that flags overbought and oversold reversal zones.
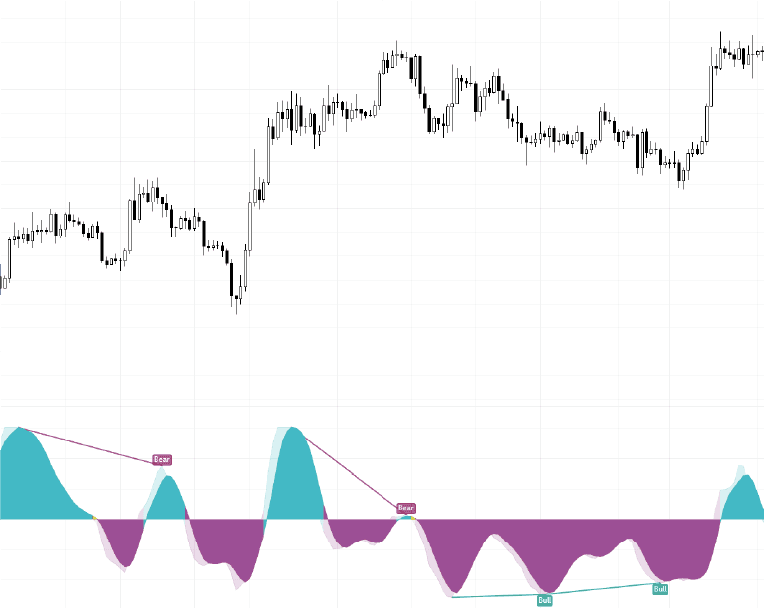
Momentum Range Selector
Combines volume, volatility, and trend-following oscillators into one momentum read, helping traders catch shifts before a reversal takes hold.
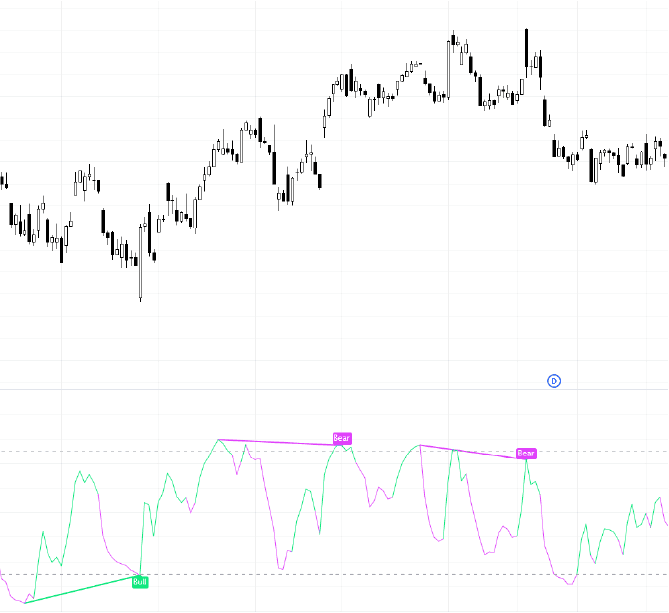
Persistent Trend Index
Extends RSI with a trend-persistence calculation to reveal whether a trend is holding strong or quietly running out of steam.
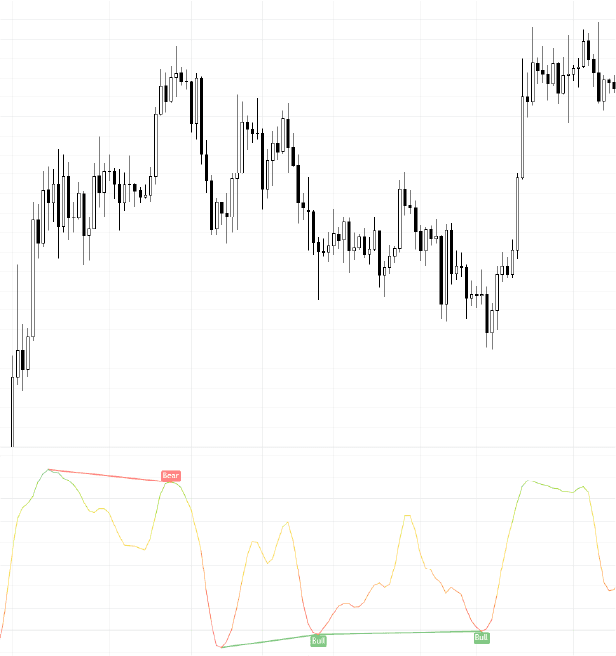
StochastiX
A refined take on the classic Stochastic Oscillator that filters noise and highlights overbought/oversold extremes ahead of likely reversals.
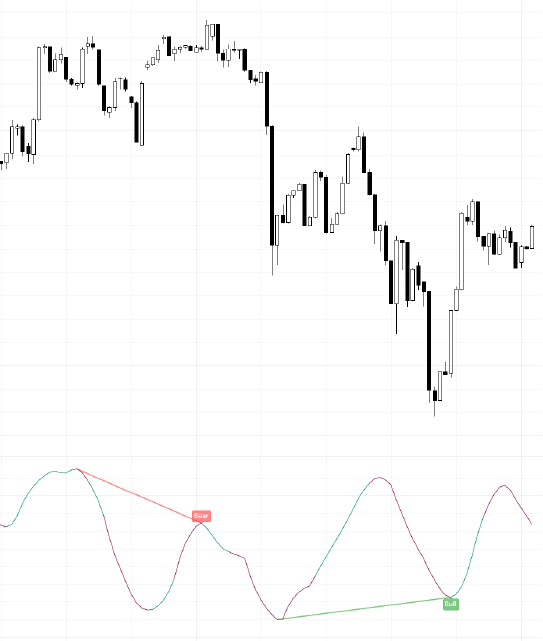
Weighted Pulse
Distills market sentiment against trend strength into a single smoothed pulse, giving traders an early read on momentum shifts and reversals.
Free Indicators
Published free on TradingView — no subscription required.
Ready to trade with an edge?
Subscribe to unlock all fifteen premium indicators across Pulse, Navigator, and Dynamics.
View Pricing