MADALGODocs
Back to site
🌐Get Started
  • What Is MADALGO?
  • What Is TradingView?
  • Setup MADALGO On TradingView
  • Join MADALGO In Discord
πŸ“ŠMADALGO Premium Solutions
  • MADALGO Pulse
  • MADALGO Navigator
  • MADALGO Dynamics
  • Updating MADALGO
  • Setting Alerts
  • Changelogs
πŸ“ˆTechnical Analysis
  • Charts
  • Volume
  • Support & Resistance
  • Trends
  • Technical Indicators
πŸ“šTrading β€” Best Practices
  • Trader Profile
  • Diversification
  • Money Management
  • Emotional Discipline
  • Do's & Don'ts
  • Recommended Brokers
❓FAQ
  • Frequently Asked Questions
πŸ”—Useful Links
  • Discord
  • YouTube
  • X
  • FB
  • Free Indicators
  • Help Center - TradingView
🌐Get Started
  • What Is MADALGO?
  • What Is TradingView?
  • Setup MADALGO On TradingView
  • Join MADALGO In Discord
πŸ“ŠMADALGO Premium Solutions
  • MADALGO Pulse
  • MADALGO Navigator
  • MADALGO Dynamics
  • Updating MADALGO
  • Setting Alerts
  • Changelogs
πŸ“ˆTechnical Analysis
  • Charts
  • Volume
  • Support & Resistance
  • Trends
  • Technical Indicators
πŸ“šTrading β€” Best Practices
  • Trader Profile
  • Diversification
  • Money Management
  • Emotional Discipline
  • Do's & Don'ts
  • Recommended Brokers
❓FAQ
  • Frequently Asked Questions
πŸ”—Useful Links
  • Discord
  • YouTube
  • X
  • FB
  • Free Indicators
  • Help Center - TradingView
Docs
  • FAQ
  • Intro
  • Guides
  • Technical Analysis
Community
  • Discord
  • X
  • YouTube
More
  • Programs
  • Blog
Copyright Β© 2026 MADALGO. Licensed under CC BY-NC-ND 4.0

Charts

For a technical analyst, viewing historical market data is paramount, and this is achieved through trading charts. Such charts present various data, predominantly market prices, volume, and technical indicators.

Here are some of the most frequently used trading charts

Line Chart

This is the most basic chart form, showing closing prices over time as a singular, unbroken line.
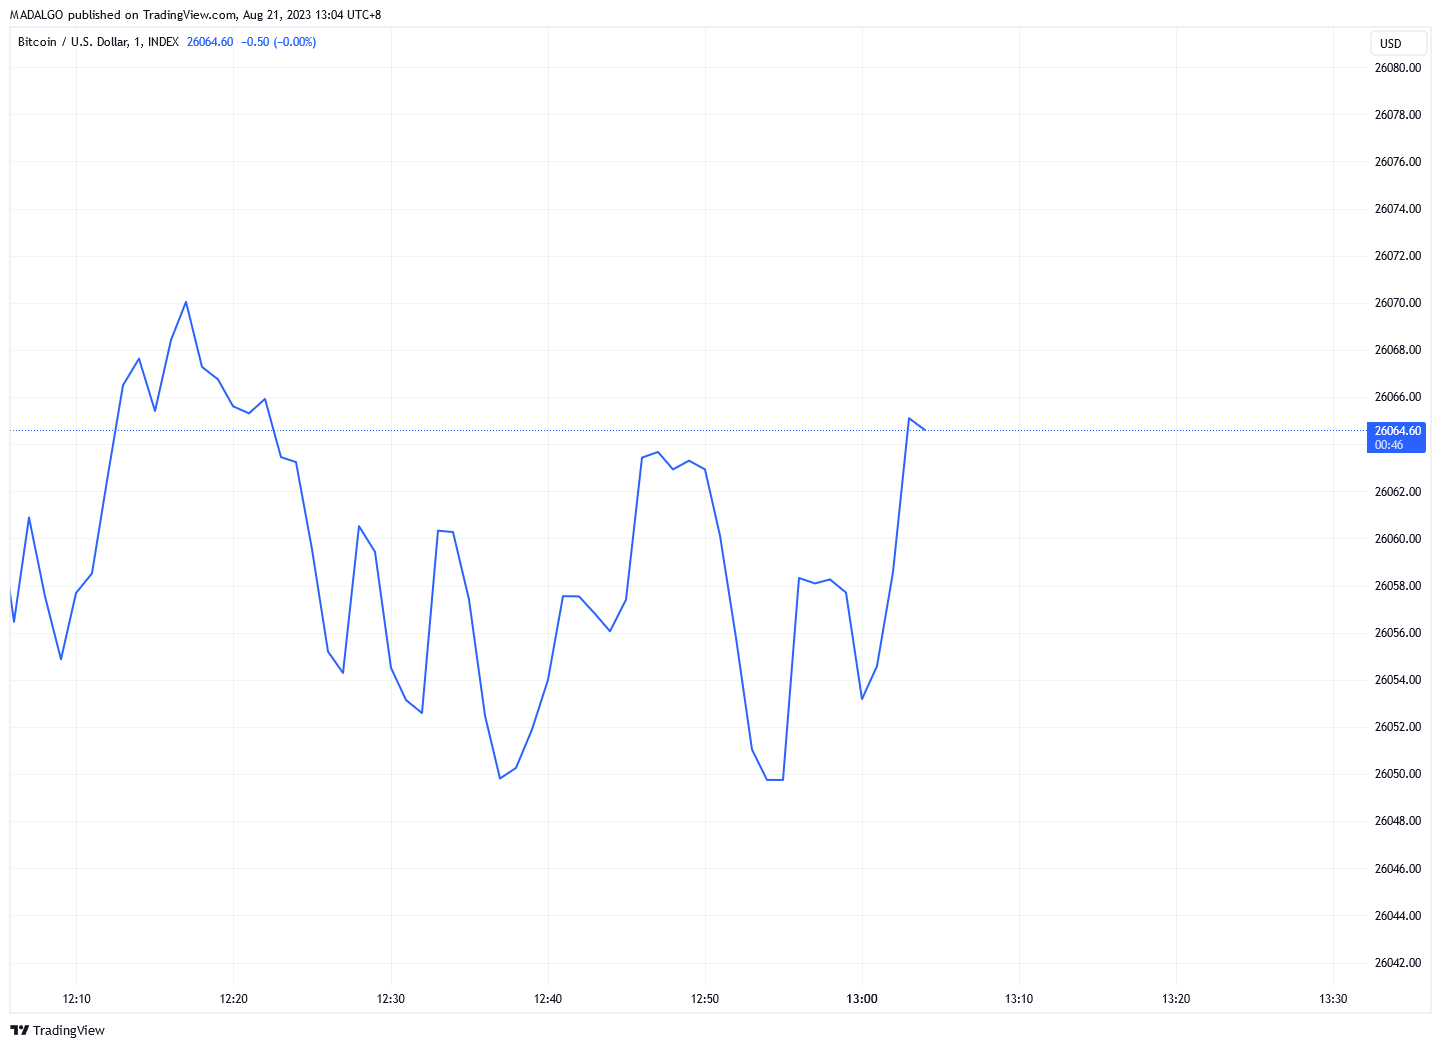
Typical line chart

Candlestick Chart

Candlestick charts are predominantly favored by traders. In contrast to line charts which typically show a sequence of closing prices, candlestick charts depict candles that provide information on the opening, high, low, and closing prices.
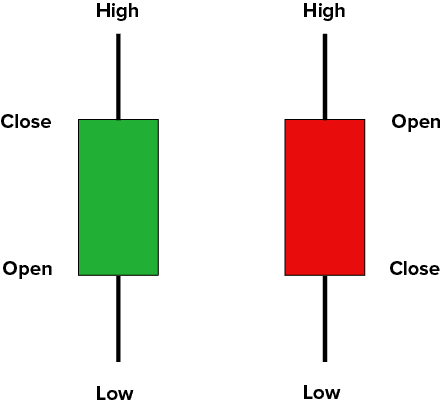
Candlesticks

The segment between the opening and closing price is termed the body of the candle, whereas the slender lines linking the high/low prices are known as wicks or shadows.

A bullish candle emerges when the closing price exceeds the opening price, whereas a bearish candle appears when the closing price is beneath the opening price.
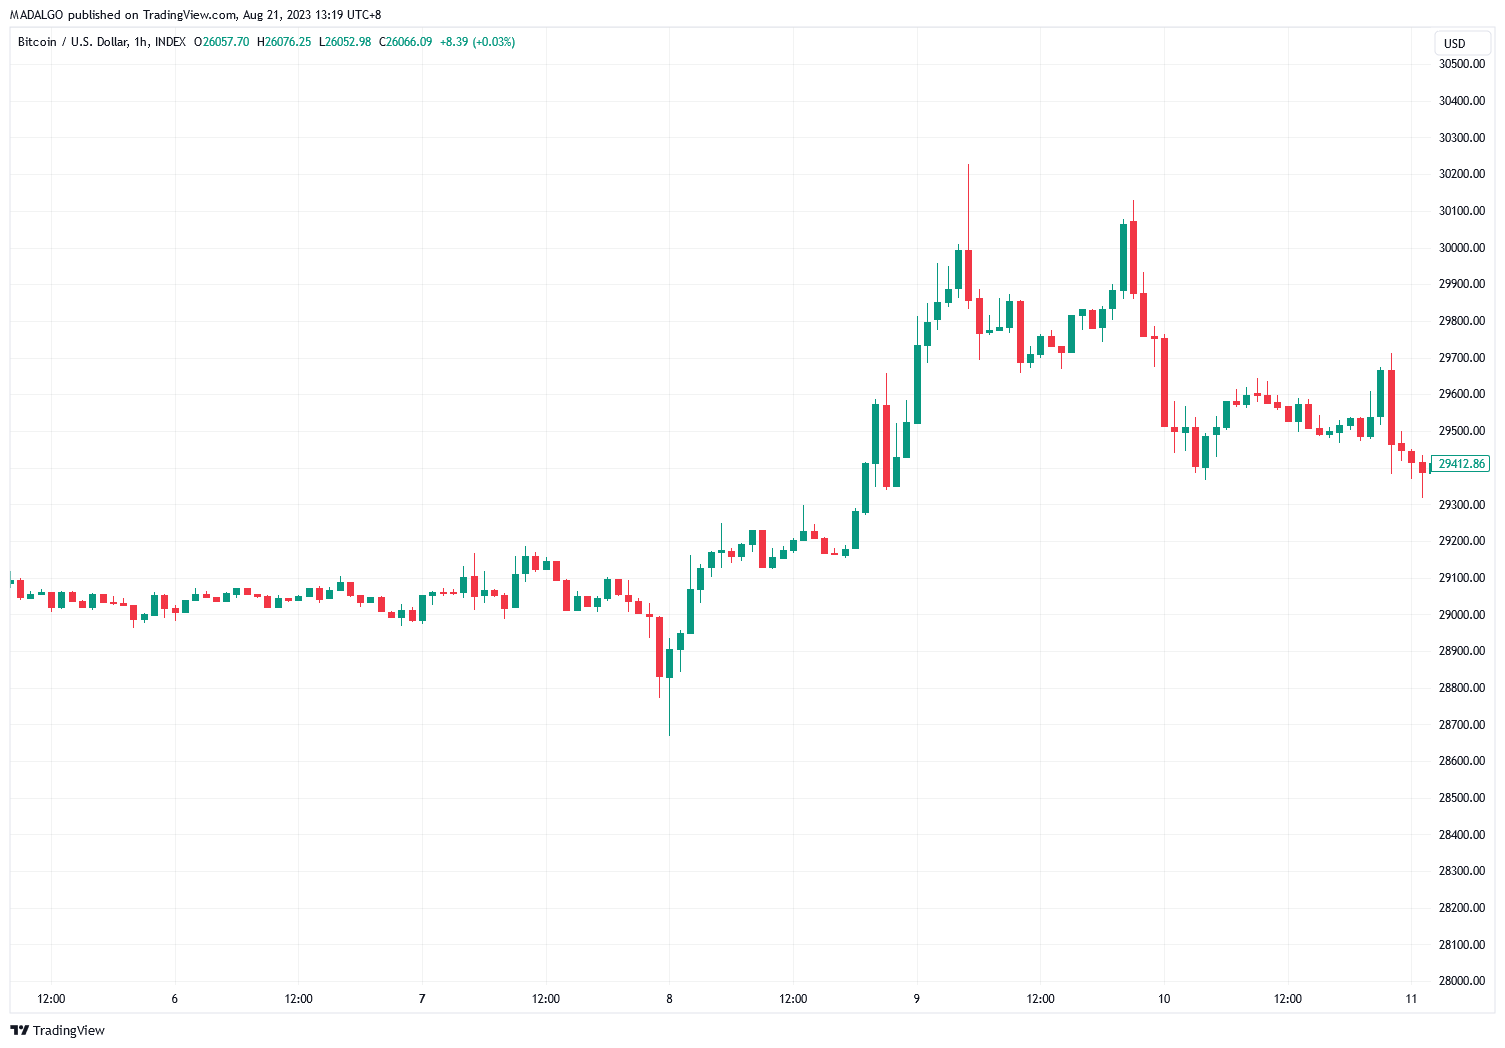
Candlestick chart

Heikin-Ashi Candlesticks

These candlesticks offer a refined version of the traditional candlesticks, filtering out abrupt price changes and hence, simplifying analysis.

Danger

It's vital to understand that heikin-ashi candles don't represent actual market price values. It's not advisable to backtest strategies using heikin-ashi since the outcomes could be skewed. Further details can be found here.
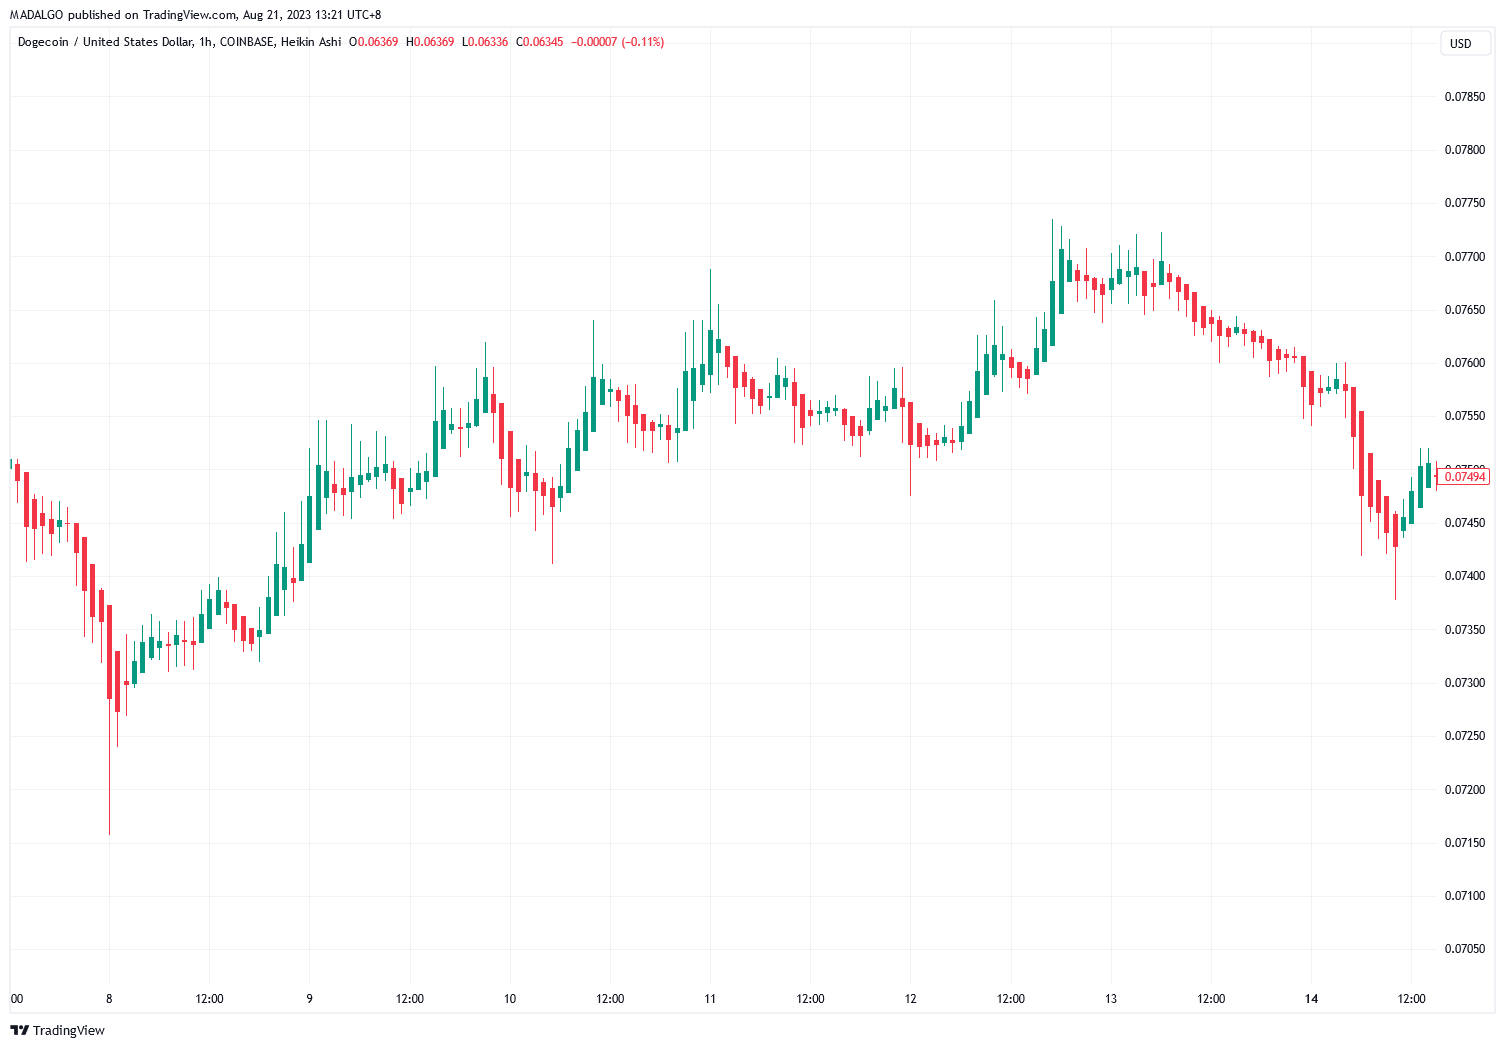
Heikin Ashi Candles

The values presented by heikin-ashi candles are computed as follows:

  • HA Open
  • HA Close
  • HA High
  • HA Low
Ot=2Otβˆ’1+Ctβˆ’12O^t = \frac{2O^{t-1} + C^{t-1}}{2}Ot=22Otβˆ’1+Ctβˆ’1​
Ct=Ot+Ht+Lt+Ct4C^t = \frac{O^t + H^t + L^t + C^t}{4}Ct=4Ot+Ht+Lt+Ct​
Ht=max⁑(Ct,Ot,Ht)H^t = \max(C^t, O^t, H^t)Ht=max(Ct,Ot,Ht)
Lt=min⁑(Ct,Ot,Lt)L^t = \min(C^t, O^t, L^t)Lt=min(Ct,Ot,Lt)

TradingView enables users to observe the genuine opening and closing prices on a heikin-ashi chart by choosing the Show real prices on price scale option (instead of the heikin-ashi price) within the chart preferences.

Show Real Prices Heikin Ashi

Due to the smoother characteristic of heikin-ashi charts, indicators applied to them often yield fewer false signals.

← PreviousMADALGO DynamicsNext β†’Volume

On this page

  • Line Chart
  • Candlestick Chart
  • Heikin-Ashi Candlesticks