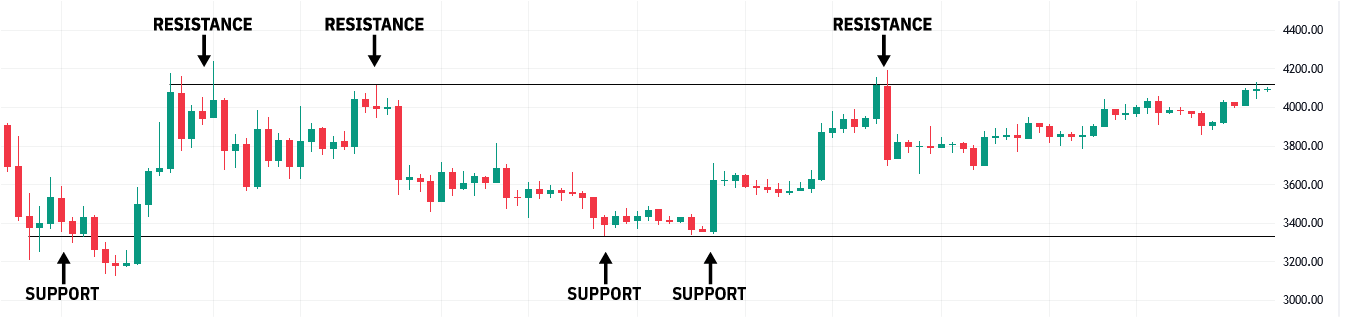
Support and resistance levels are fundamental concepts in technical analysis that provide insights into potential buy or sell points in the market. A support level is typically seen as a price level at which a security tends to find buying interest, preventing the price from falling below the level. It's akin to the safety net below which traders expect minimal price drop. Conversely, a resistance level is where selling interest intensifies, making it difficult for the price to rise above that point. It's often viewed as the ceiling that price struggles to breach. These levels can be identified by analyzing historical price data and looking for points where price reversed direction.
These levels aren't set in stone. They are zones where traders and investors have historically shown strong sentiment, causing a reversal in price. When plotting these levels on a chart, they often serve as visual cues for potential trend reversals or continuations, assisting traders in determining entry and exit points. By recognizing these areas, traders can set stop losses, determine target prices, and understand potential price pathways, making them a crucial tool in a trader's arsenal.
Breakouts
Breakouts refer to the movement of an asset's price as it transcends beyond established support or resistance levels. They are significant indicators of potential trend shifts in the market. A breakout can occur in any direction: upward, signaling the start of a new bullish trend, or downward, indicating a potential bearish trend. Breakouts are particularly valuable as they often come with increased trading volume, reinforcing the potential for a sustainable new trend. While breakouts can signal a great opportunity for traders, it's vital to differentiate between genuine breakouts and "false" breakouts, where the price moves beyond a level but then reverses course.
Change in Polarity
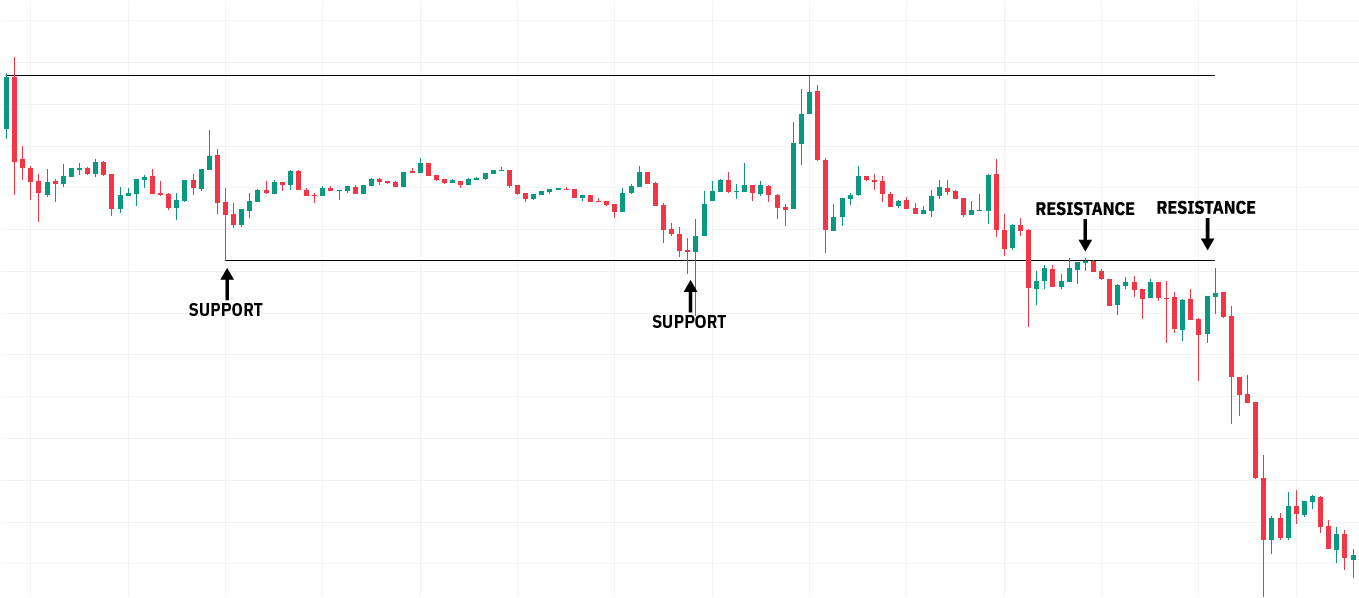
Change in polarity is a technical concept wherein a previously identified support level, once breached, transforms into a resistance level, or vice versa. This transition stems from the psychological behavior of traders. For instance, once a support level is broken, the new lower price may establish a concern that the price will continue to decrease. Thus, if the price attempts to move back up, the old support might act as a new resistance. Conversely, if a resistance level is breached and the price continues to climb, that old resistance may serve as a new support. Understanding this shift in polarity aids traders in predicting potential price movements and adjusting their strategies accordingly.