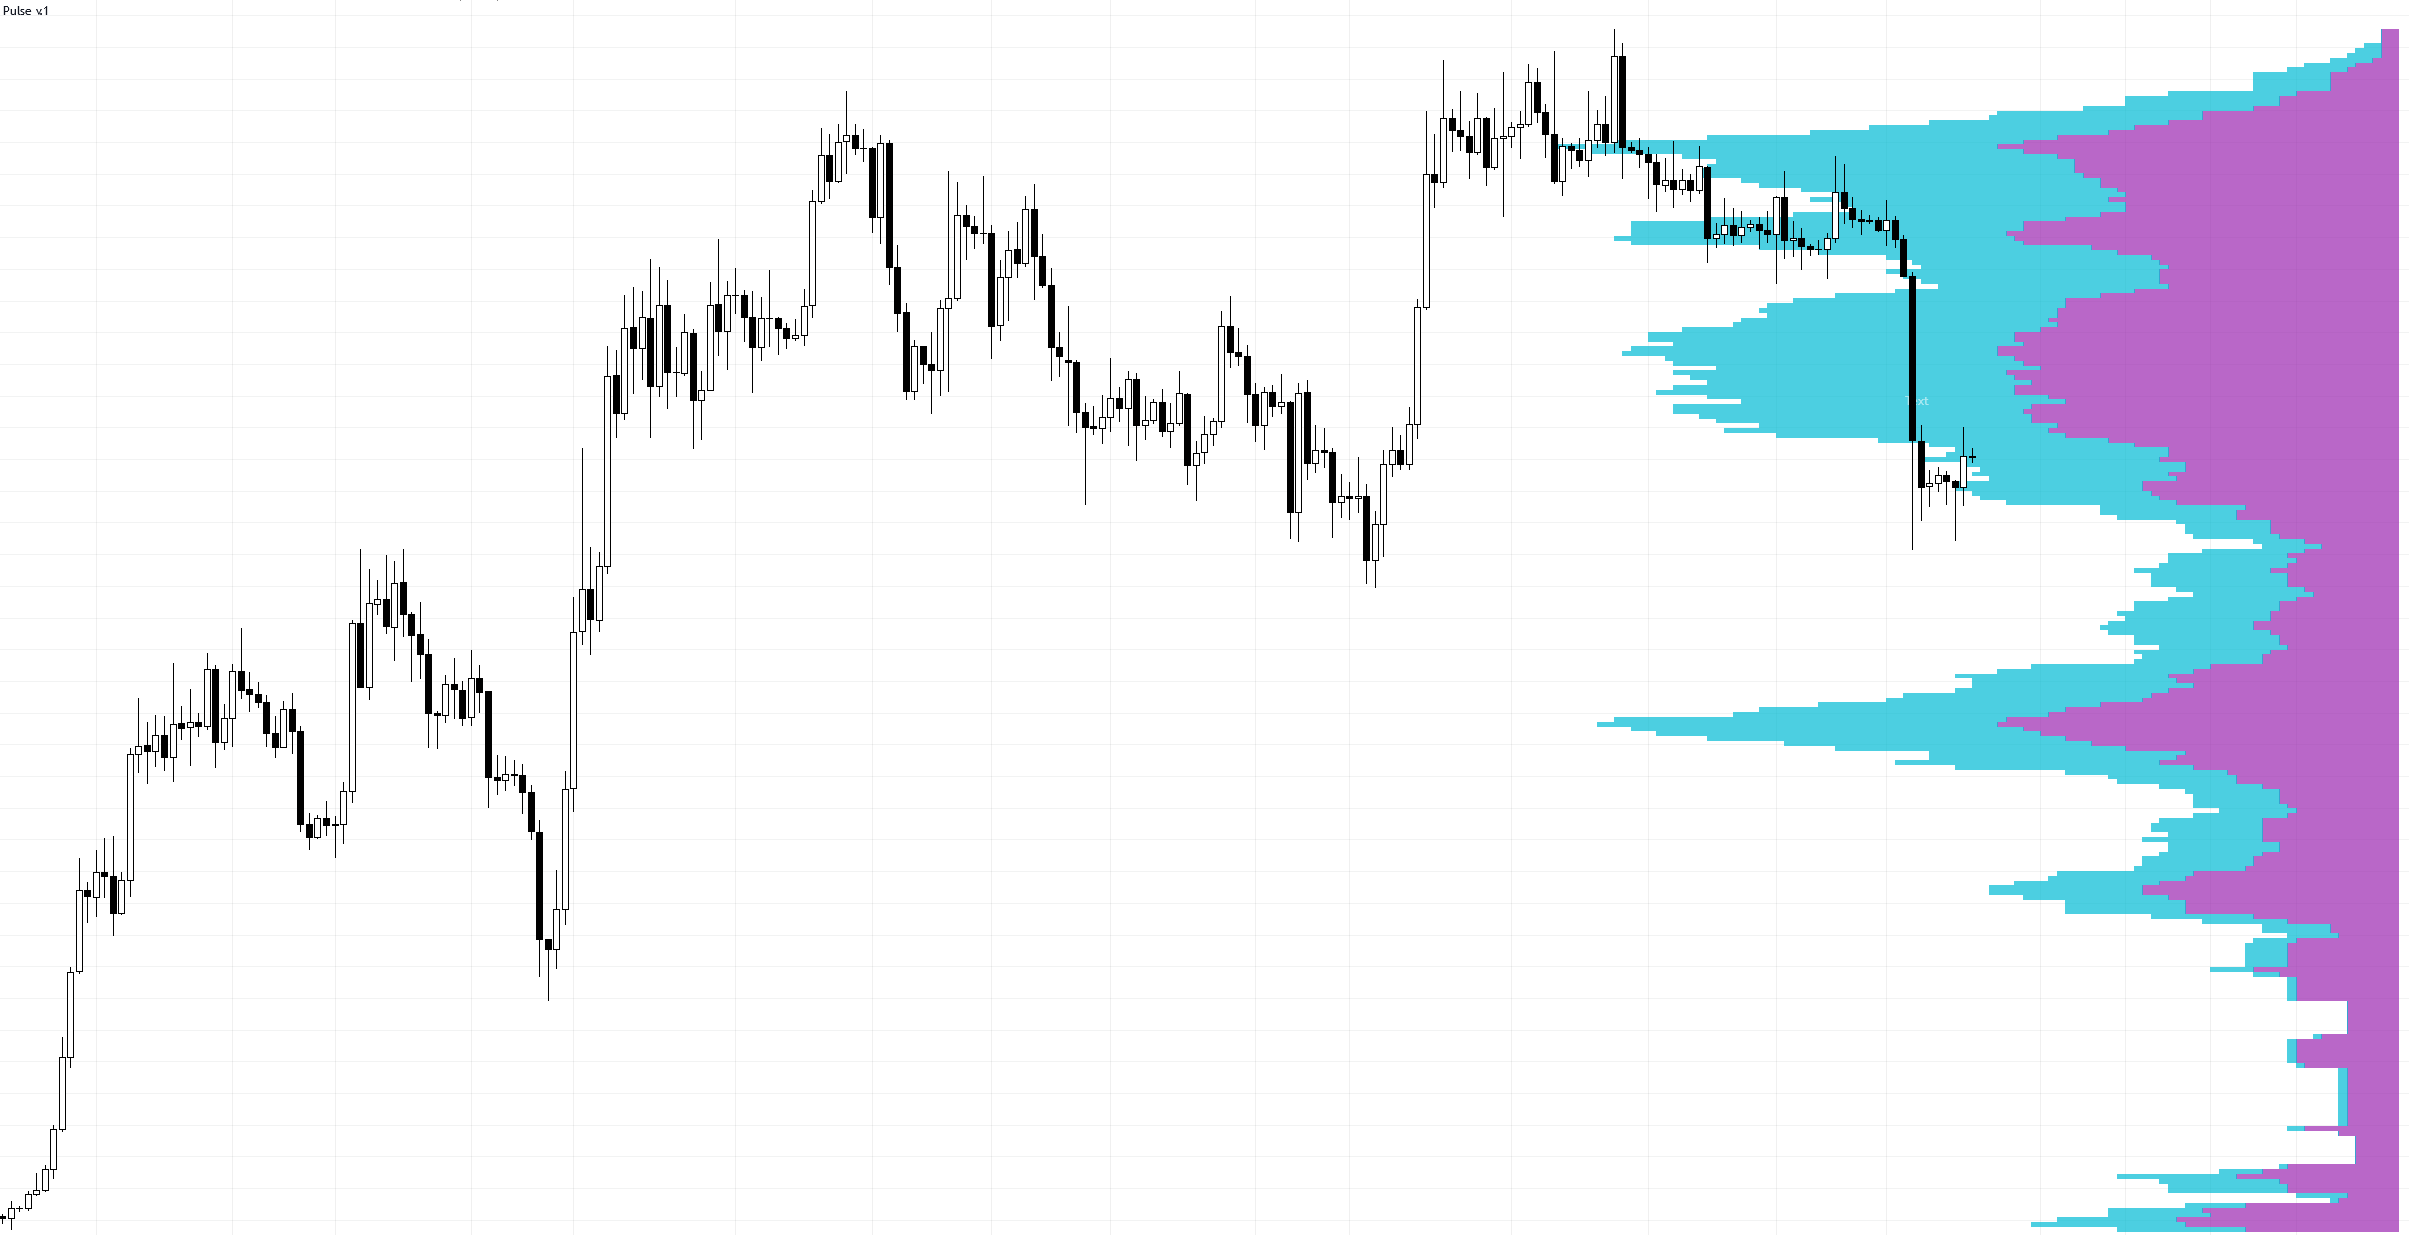
The Volume Profile Pro indicator is a powerful tool within MADALGO Pulse that allows traders to analyze volume distribution across different price levels. By visualizing the volume profile, traders can identify areas of high trading activity and make informed trading decisions. This guide will provide you with comprehensive insights into effectively using the Volume Profile Pro indicator.
Overview
The Volume Profile Pro indicator provides valuable information about volume distribution within a specified range. This information is displayed through histograms on your price chart, allowing you to identify price levels with the highest trading activity. By observing these histograms, you can better understand where buying and selling pressures are concentrated.
Settings
Before using the Volume Profile Pro indicator, familiarize yourself with its customizable settings. Here are the key settings you can adjust:
- FRVP (Fixed Ranged Volume Profile): Enable or disable the Fixed Ranged Volume Profile feature, which uses a lookback algorithm to determine proper lookback variables for the fixed range.
- VRVP (Visible Range Volume Profile): Enable or disable the Visible Range Volume Profile feature, which uses a real-time visible algorithm.
- Flip: Enable or disable flipping the Volume Profile Pro from one side of the chart to the other.
- Up Volume Color: Set the color for histograms representing up volume.
- Down Volume Color: Set the color for histograms representing down volume.
- Offset: Set the offset value for histograms when flipping the Volume Profile Pro.
- Width: Set the overall width of histograms.
Histogram Patterns and Interpretation
The Volume Profile Pro indicator displays histograms that represent volume distribution across price levels. Here's how to interpret the histograms:
Up Volume Histogram
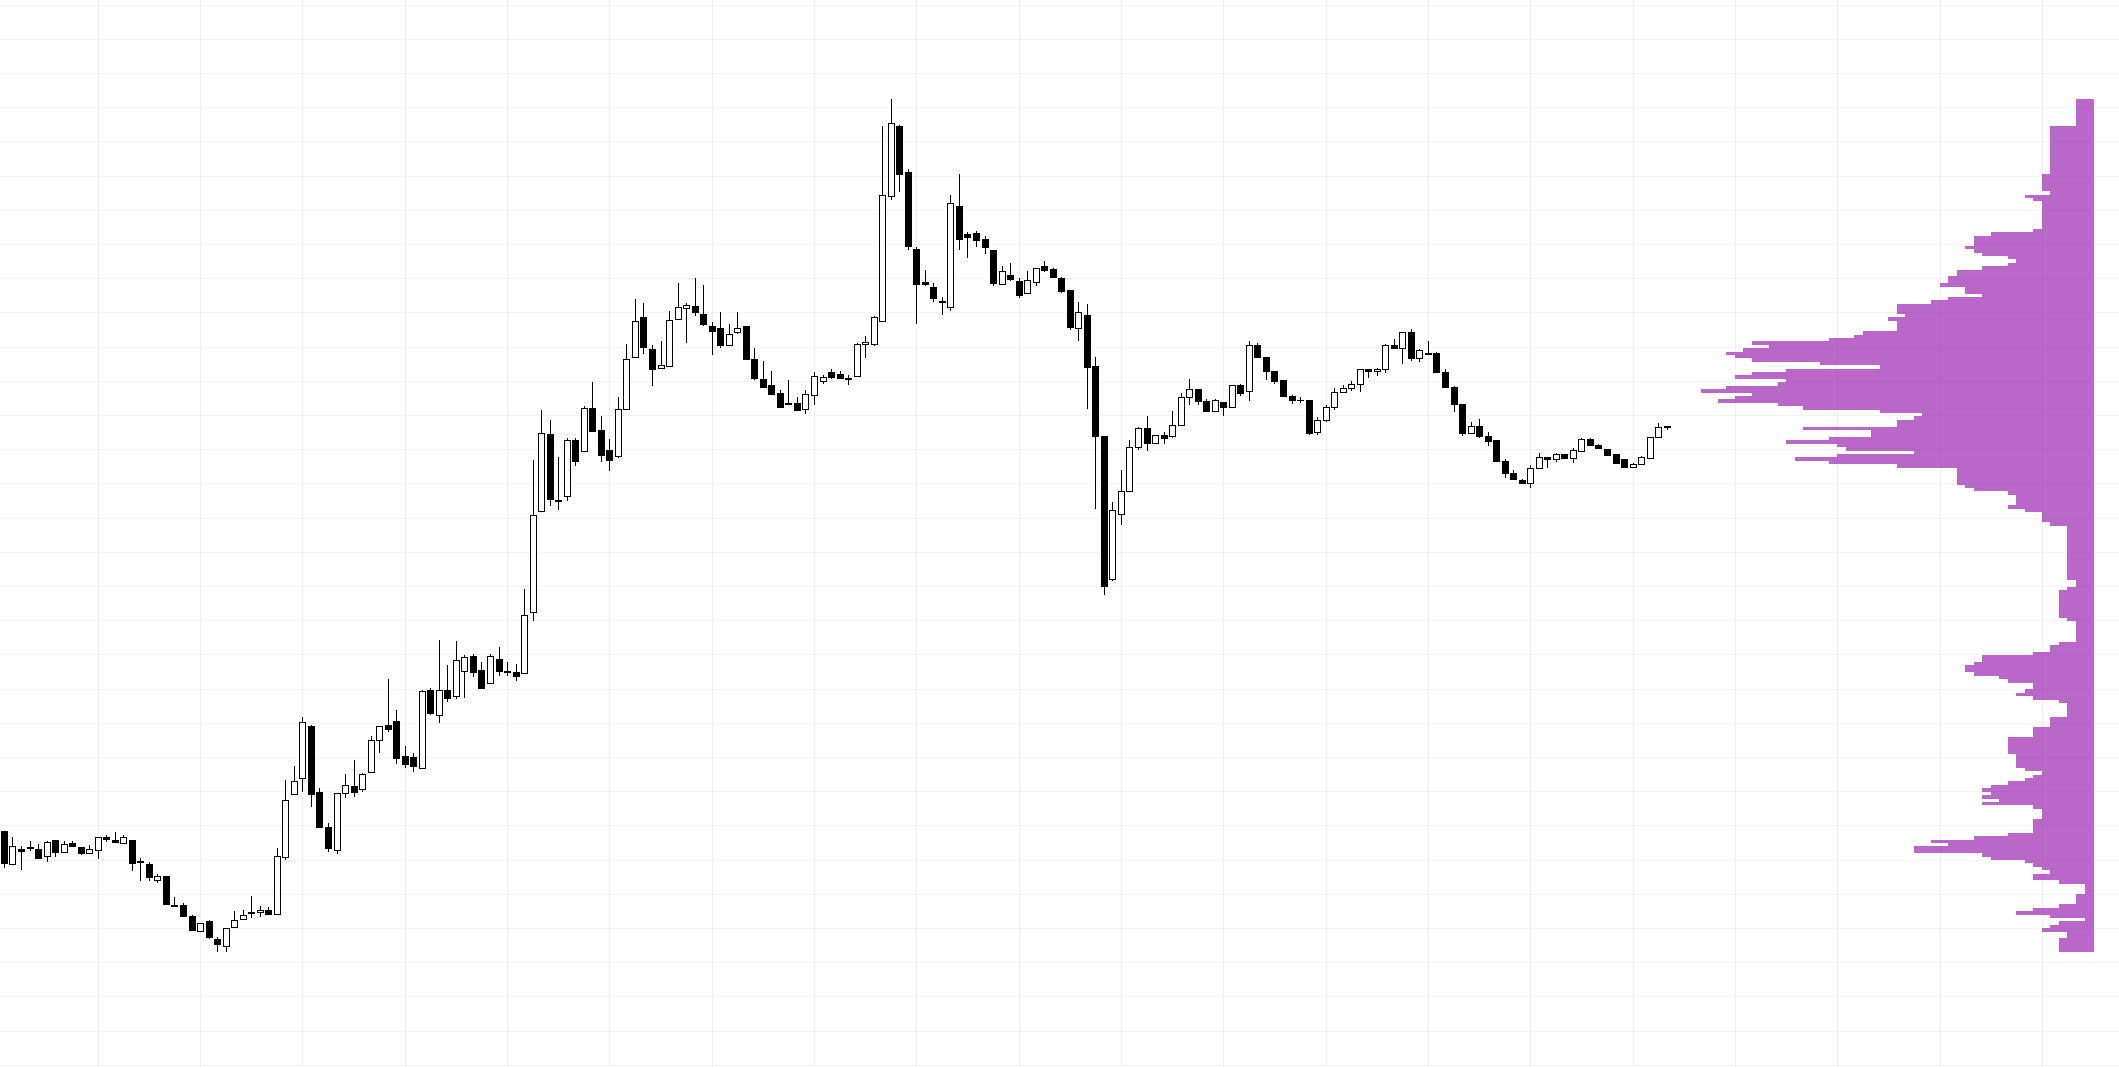
Displays the volume distribution associated with price levels during bullish price movements.
Down Volume Histogram
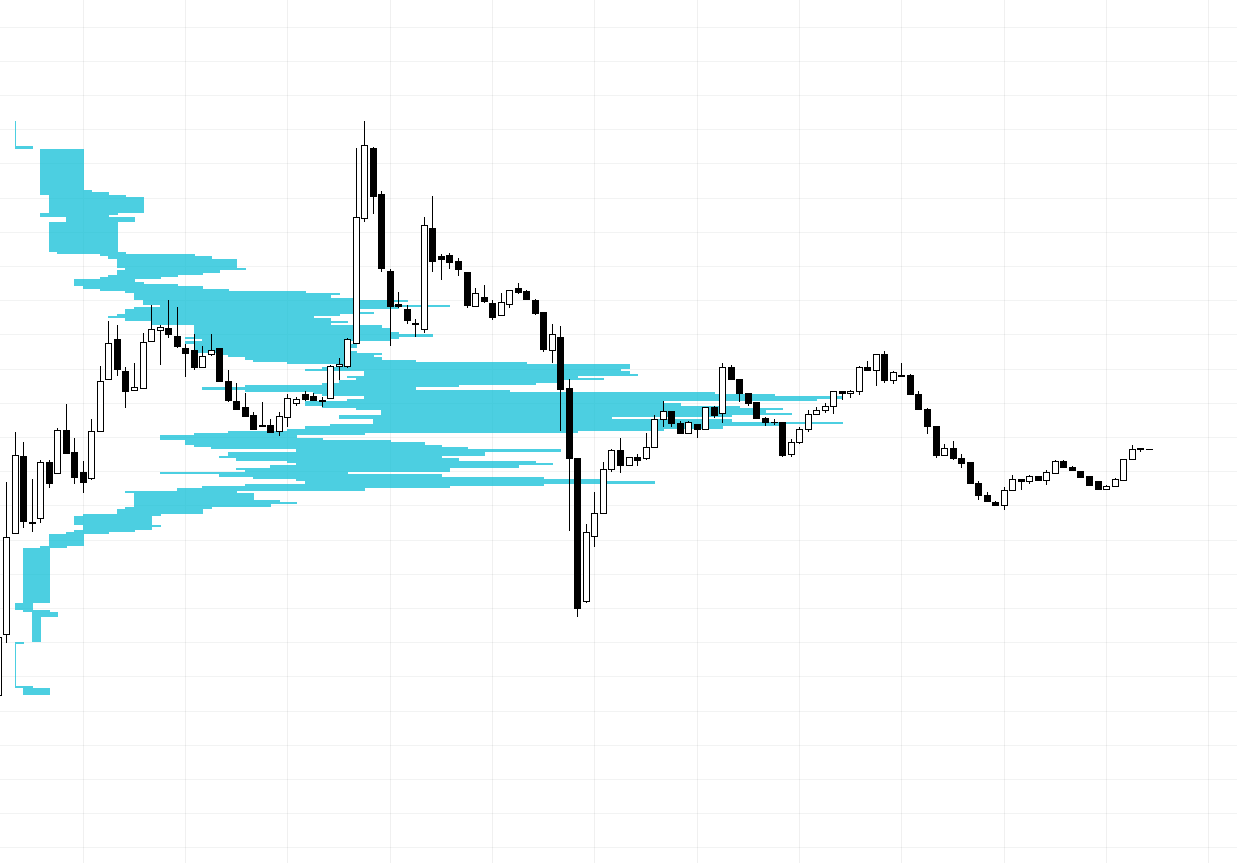
Displays the volume distribution associated with price levels during bearish price movements.
Tip
The Volume Profile Pro indicator is particularly useful for identifying support and resistance levels based on volume distribution. It can help you spot price areas where significant market activity occurs
How to Use
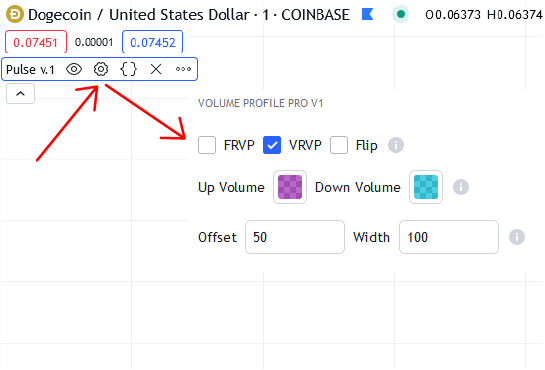
- Choose Profile Type: Decide whether to use the Fixed Ranged Volume Profile (FRVP) or the Visible Range Volume Profile (VRVP). You can also enable the "Flip" option to adjust the placement of histograms.
- Set Histogram Colors: Customize the colors of up and down volume histograms to match your preferences.
- Adjust Offset and Width: Fine-tune the offset and overall width of the histograms based on your chart display preferences.
- Observe Histograms: Pay attention to the histograms displayed on your price chart. Each histogram represents volume distribution at specific price levels.
- Interpret Histograms: Identify areas of high trading activity by observing taller histograms. These levels often indicate significant support or resistance zones.
- Combine with Technical Analysis: Use the Volume Profile Pro indicator alongside our other technical analysis tools, such as Hyper Trend or VersaMA, to validate your trading decisions.
- Confirm Reversal Points: Volume accumulation at specific price levels can signal potential trend reversal or continuation points.
By understanding how to choose between FRVP and VRVP, interpreting histogram patterns, and customizing the indicator's settings, you can enhance your trading strategy and make more informed trading decisions.
Caution
While the indicator provides insights into volume distribution, always consider using it in conjunction with other technical indicators and risk management strategies.