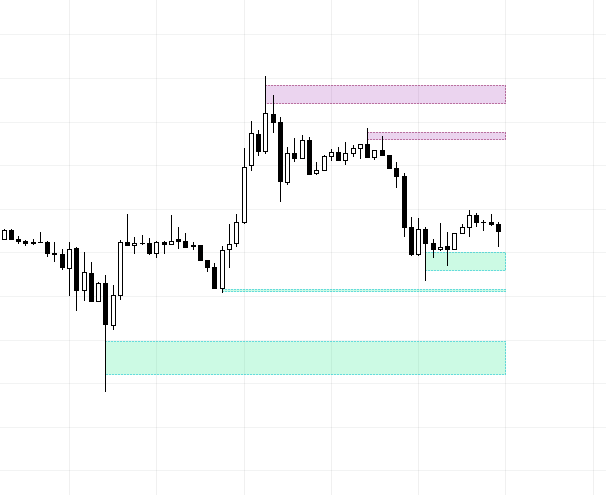
The "Institutional Liquidity Zones" (ILZ) feature in MADALGO Navigator is a powerful tool that helps traders identify potential areas of significant price levels where institutional trading activity is likely to occur. These zones can offer insights into the execution strategies of large market participants.
Settings
Before using the Institutional Liquidity Zones indicator, it's essential to familiarize yourself with its customizable settings. Here are the key settings you can adjust:
Activation
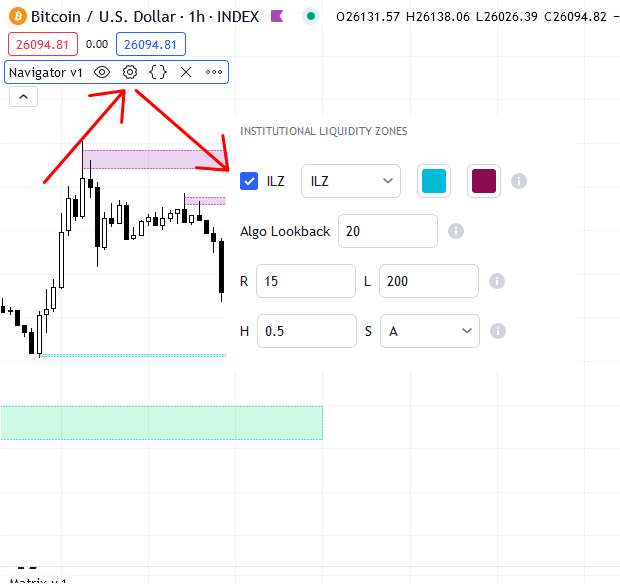
To utilize the ILZ feature, navigate to the main settings of MADALGO Navigator and toggle the "ILZ" switch to the ON position. This activates the calculation and visualization of Institutional Liquidity Zones on your chart.
Method Selection
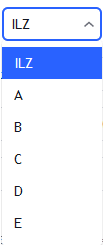
Choose from different calculation methods (A, B, C, D, E) to generate the Institutional Liquidity Zones. Each method utilizes a unique algorithm to calculate these zones based on historical price data. These methods provide varying perspectives on potential areas of liquidity accumulation.
Algo Lookback

Adjust the "Algo Lookback" parameter to determine the lookback period for the calculation of Institutional Liquidity Zones. This setting defines the number of past bars the algorithm considers when identifying potential zones. A longer lookback period may capture zones with a broader historical context.
Styling
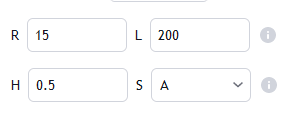
The ILZ feature allows for customization of the visual appearance of the Institutional Liquidity Zones:
- Bear and Bull Box Colors: Choose colors for bearish and bullish liquidity zones. These colors help distinguish between areas where institutions are likely to sell or buy.
- Box Border Width and Style: Adjust the width and style of the border lines of the liquidity zone boxes. This customization helps you visualize the zones in a way that aligns with your preferences.
Tip
Try different calculation methods to understand how each method generates liquidity zones. This experimentation can help you find the method that aligns best with your trading strategy.
Visual Display
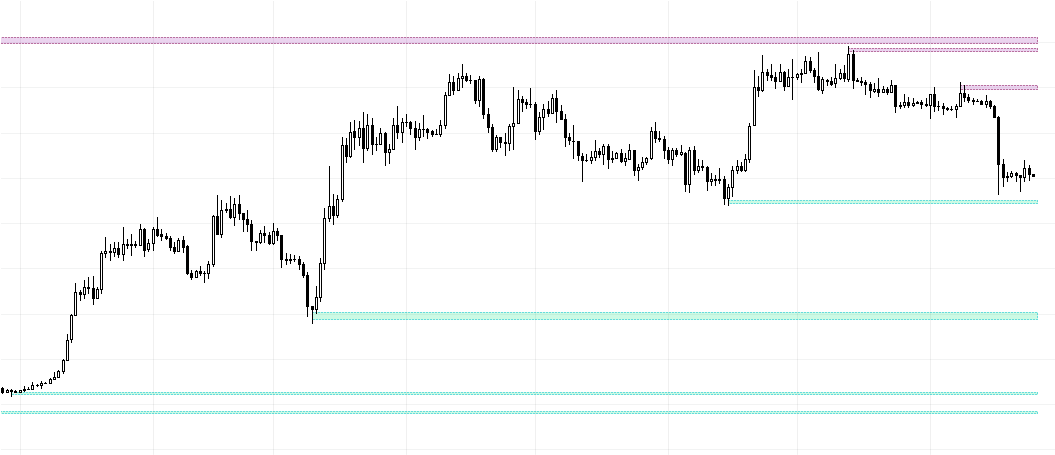
The Institutional Liquidity Zones are visually displayed on your chart as rectangular boxes. These boxes are drawn around the calculated zones, indicating potential areas of interest. The display of these zones can be configured based on your chosen settings.
Importance and Use
Key Price Levels
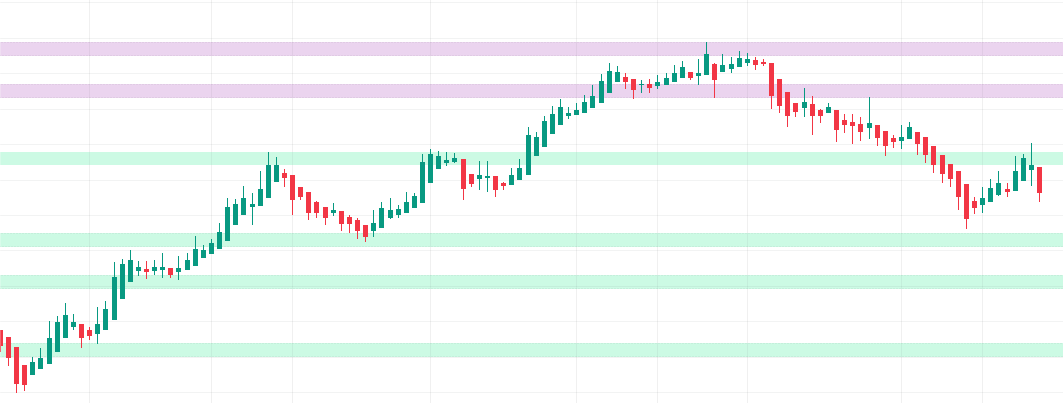
Institutional Liquidity Zones often correspond to key price levels on the chart. These levels may include previous support and resistance zones, pivot points, and other critical levels. Monitoring these zones can help you anticipate potential price movements.
Info
Incorporate Institutional Liquidity Zones into your broader technical and fundamental analysis. These zones are most effective when used in conjunction with other tools and indicators.
Order Execution Strategy
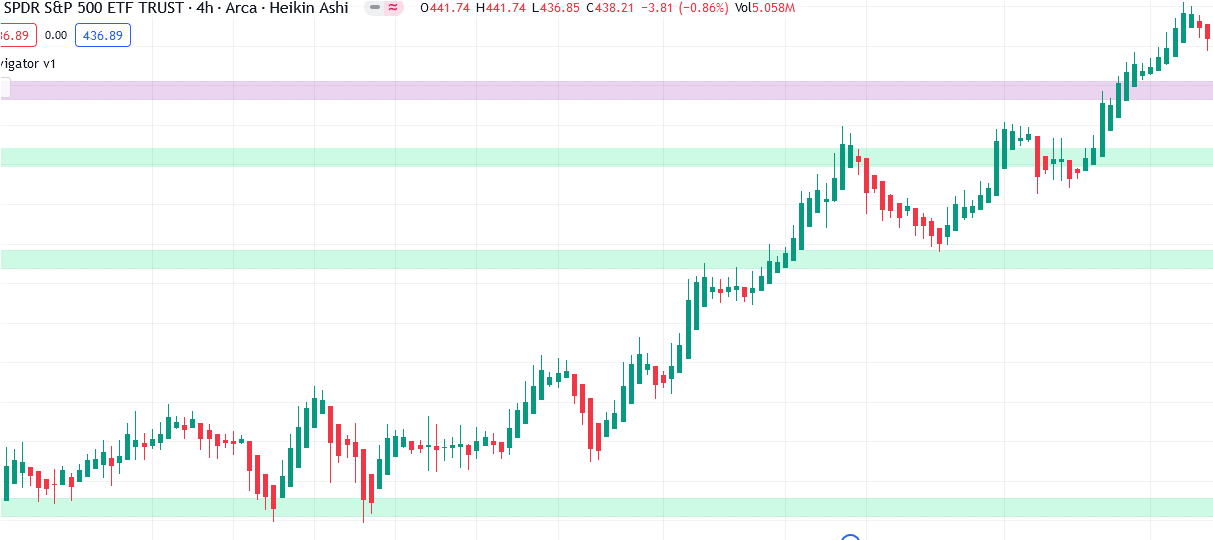
Institutional traders seek to execute large orders with minimal slippage and impact costs. The ILZ feature provides insights into where institutions may intend to execute trades. This information can be valuable for your trading decisions, especially when aligning your strategies with institutional activity.
Caution
Disclaimer: The information provided here is for educational purposes only and does not constitute financial advice. Trading involves risk, and it's essential to conduct thorough research and seek advice from financial professionals before making any trading decisions.