MADALGODocs
Back to site
๐ŸŒGet Started
  • What Is MADALGO?
  • What Is TradingView?
  • Setup MADALGO On TradingView
  • Join MADALGO In Discord
๐Ÿ“ŠMADALGO Premium Solutions
  • MADALGO Pulse
  • MADALGO Navigator
  • MADALGO Dynamics
  • Updating MADALGO
  • Setting Alerts
  • Changelogs
๐Ÿ“ˆTechnical Analysis
  • Charts
  • Volume
  • Support & Resistance
  • Trends
  • Technical Indicators
    • Momentum Indicators
    • Trend Indicators
    • Volatility Indicators
    • Volume Indicators
๐Ÿ“šTrading โ€” Best Practices
  • Trader Profile
  • Diversification
  • Money Management
  • Emotional Discipline
  • Do's & Don'ts
  • Recommended Brokers
โ“FAQ
  • Frequently Asked Questions
๐Ÿ”—Useful Links
  • Discord
  • YouTube
  • X
  • FB
  • Free Indicators
  • Help Center - TradingView
๐ŸŒGet Started
  • What Is MADALGO?
  • What Is TradingView?
  • Setup MADALGO On TradingView
  • Join MADALGO In Discord
๐Ÿ“ŠMADALGO Premium Solutions
  • MADALGO Pulse
  • MADALGO Navigator
  • MADALGO Dynamics
  • Updating MADALGO
  • Setting Alerts
  • Changelogs
๐Ÿ“ˆTechnical Analysis
  • Charts
  • Volume
  • Support & Resistance
  • Trends
  • Technical Indicators
    • Momentum Indicators
    • Trend Indicators
    • Volatility Indicators
    • Volume Indicators
๐Ÿ“šTrading โ€” Best Practices
  • Trader Profile
  • Diversification
  • Money Management
  • Emotional Discipline
  • Do's & Don'ts
  • Recommended Brokers
โ“FAQ
  • Frequently Asked Questions
๐Ÿ”—Useful Links
  • Discord
  • YouTube
  • X
  • FB
  • Free Indicators
  • Help Center - TradingView
Docs
  • FAQ
  • Intro
  • Guides
  • Technical Analysis
Community
  • Discord
  • X
  • YouTube
More
  • Programs
  • Blog
Copyright ยฉ 2026 MADALGO. Licensed under CC BY-NC-ND 4.0

Momentum Indicators

Momentum Indicators

Momentum indicators, commonly referred to as oscillators, strip away the trend component from the price, spotlighting the cyclical aspect. They are typically leading indicators and are displayed in a distinct panel.

Popular Momentum Indicators

A plethora of oscillators exist, each boasting unique features. The momentum oscillator stands out due to its simplicity; it's calculated by:

Ctโˆ’Ctโˆ’pC_t - C_{t-p}Ctโ€‹โˆ’Ctโˆ’pโ€‹

Some momentum indicators, like the renowned Moving Average Convergence Divergence (MACD), TRIX, and Awesome Oscillator, employ smoothing techniques. Though they offer clearer insights, they can sometimes lag.
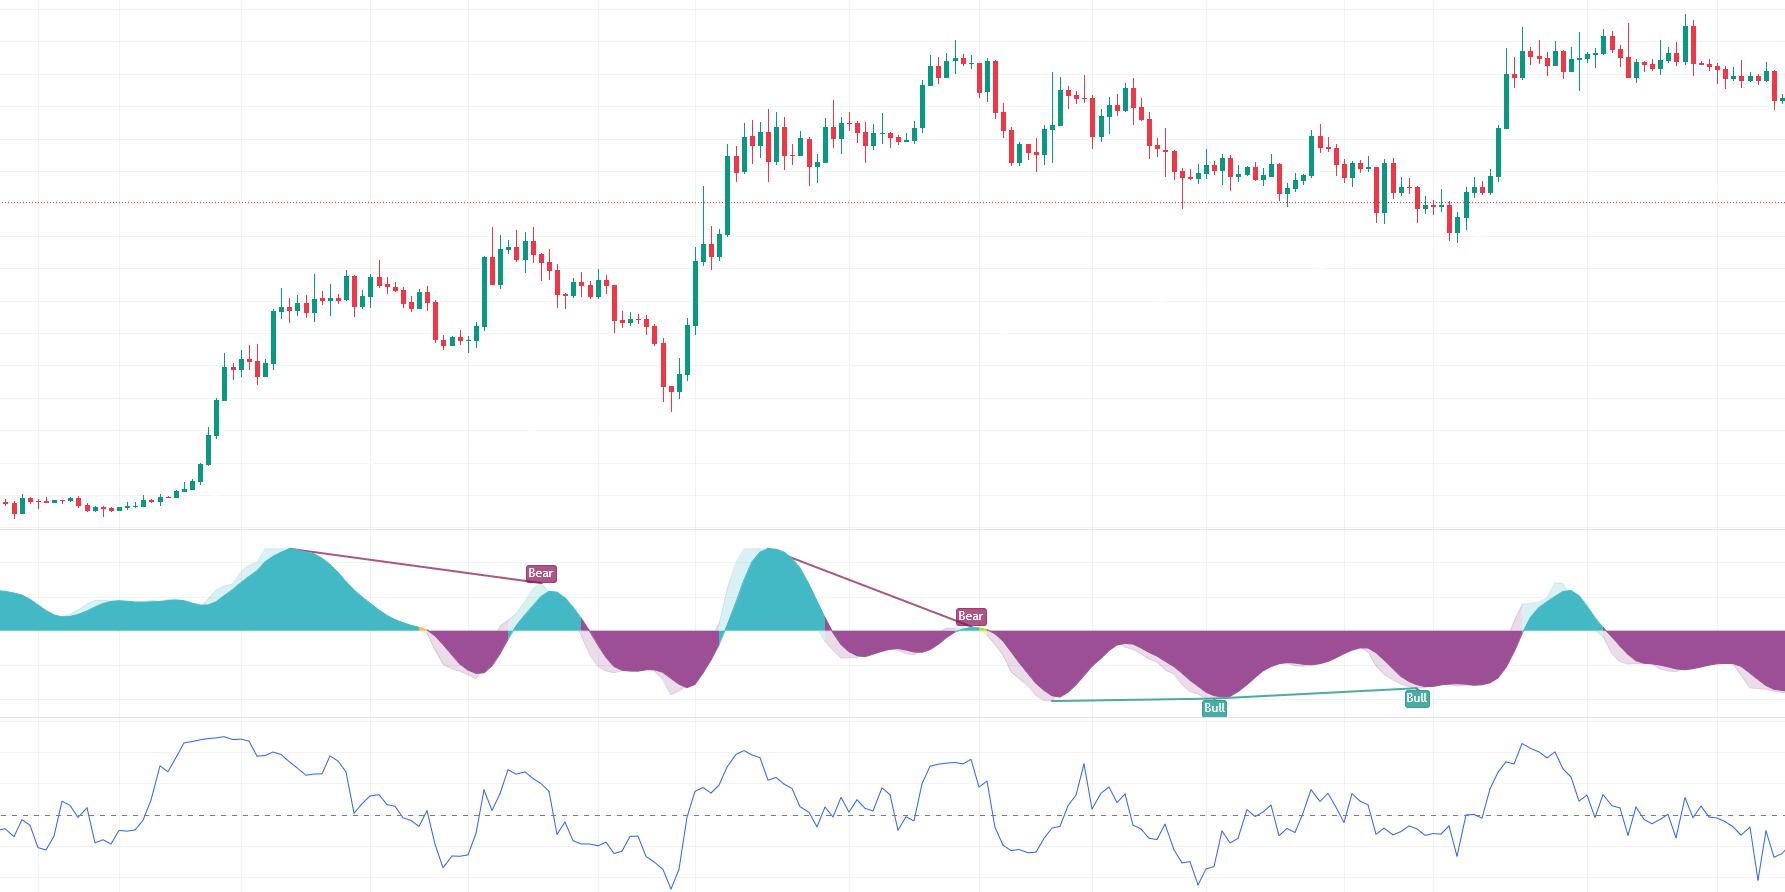
MADALGO Matrix (top) and momentum oscillator (bottom)

Scale-Neutral Momentum Indicators

Certain momentum indicators are scale-neutral, meaning they maintain a consistent scale, irrespective of the price's original scale. For instance, an oscillator is scale-neutral when:

Osct(kCt)=Osct(Ct)\text{Osc}_{t}(kC_t) = \text{Osc}_{t}(C_t)Osctโ€‹(kCtโ€‹)=Osctโ€‹(Ctโ€‹)

where k is a positive integer. These oscillators, sometimes termed normalized, have fixed ranges. The Relative Strength Index (RSI) is a prime example of such an indicator.
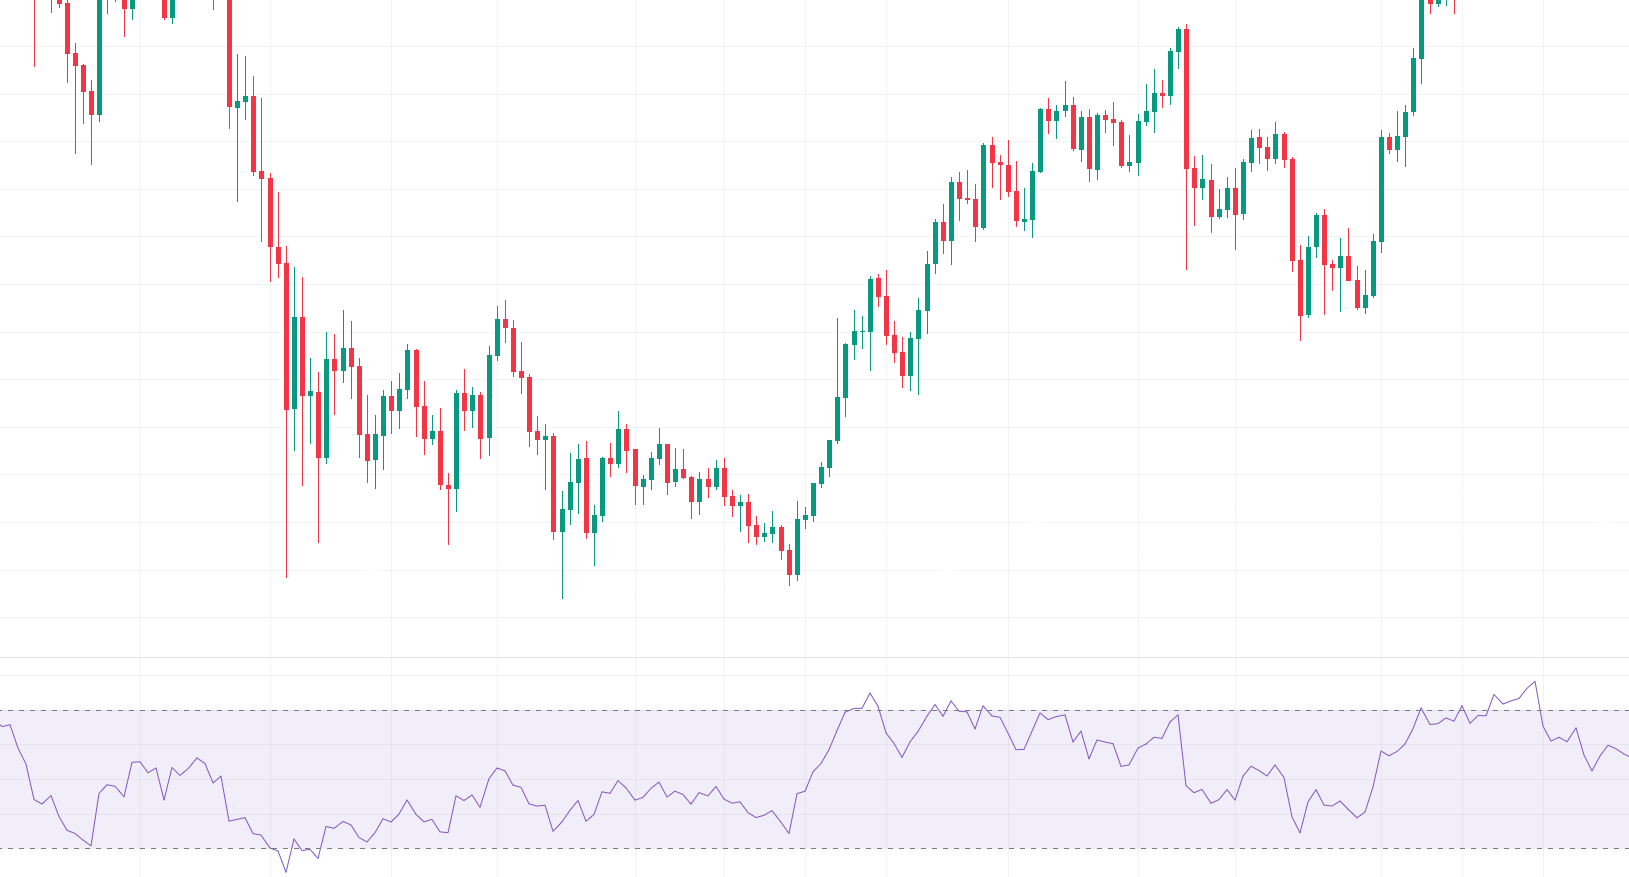
RSI (bottom) with length equal to 14

The Stochastic Oscillator, another scale-neutral tool, comprises a %K line and its smoother counterpart, %D. These scale-neutral indicators' merit is their ability to maintain fixed "overbought" and "oversold" levels, assisting traders in gauging market extremities.
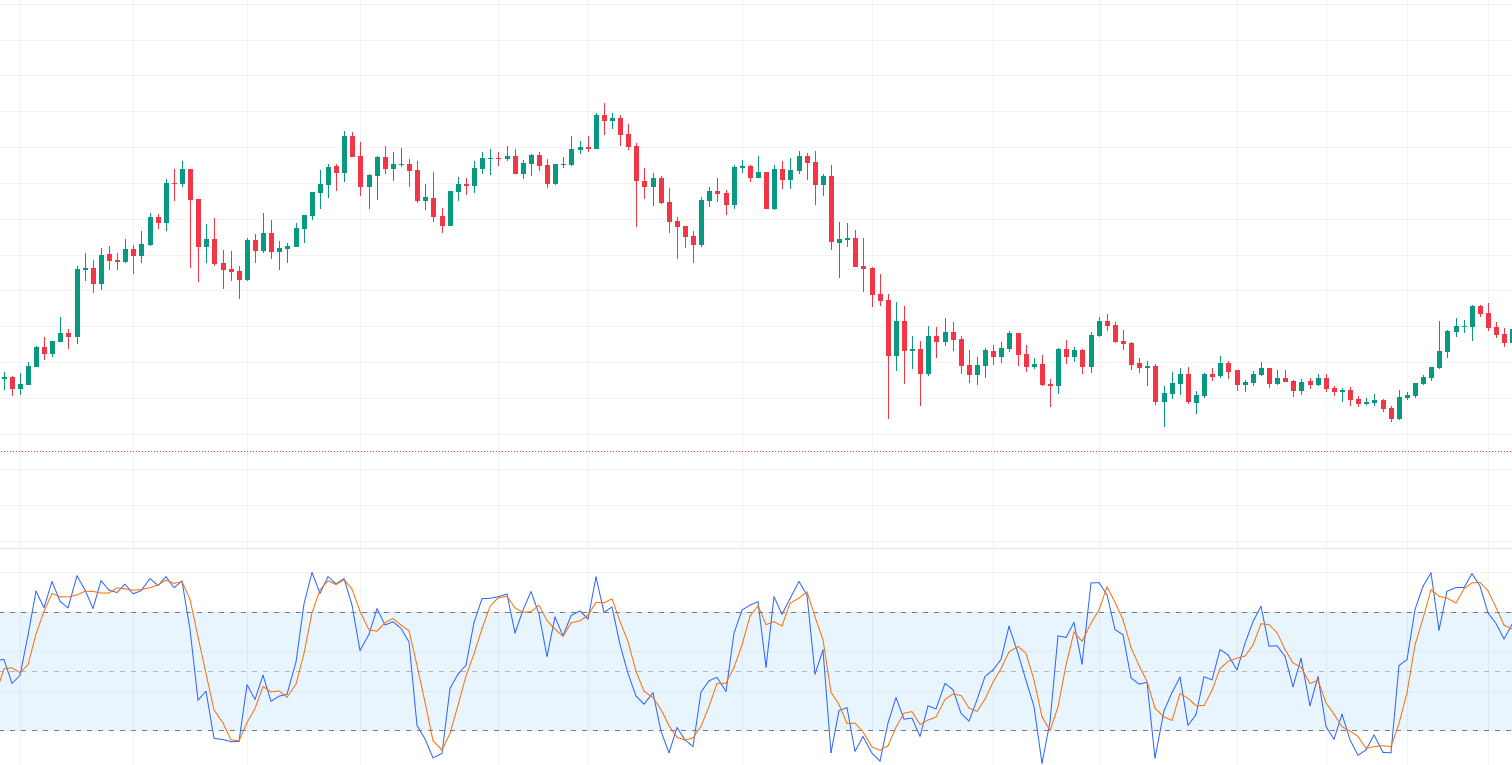
Stochastic oscillator %K in blue and %D in orange

Other notable momentum indicators include the Commodity Channel Index (CCI), True Strength Index (TSI), and William %R.

Detecting Divergences
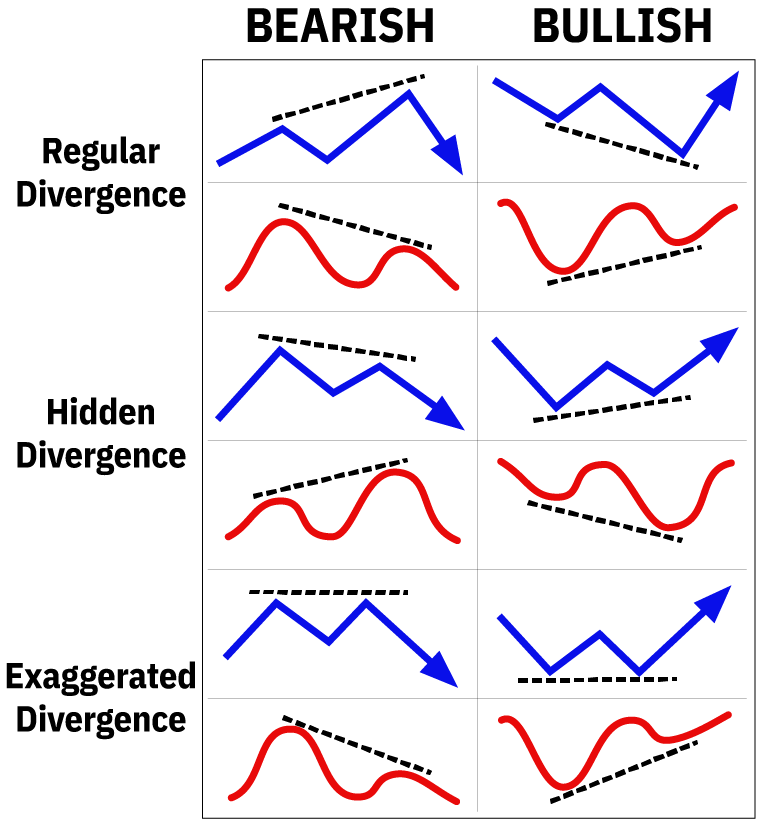
Types of Divergences

Traders employ momentum indicators to pinpoint divergences between price and the oscillator. A divergence arises when price and the indicator move in contrasting directions. This discrepancy can be assessed by examining the peaks and troughs created by both the price and the indicator.

โ† PreviousTechnical IndicatorsNext โ†’Trend Indicators

On this page

  • Popular Momentum Indicators
  • Scale-Neutral Momentum Indicators
  • Detecting Divergences