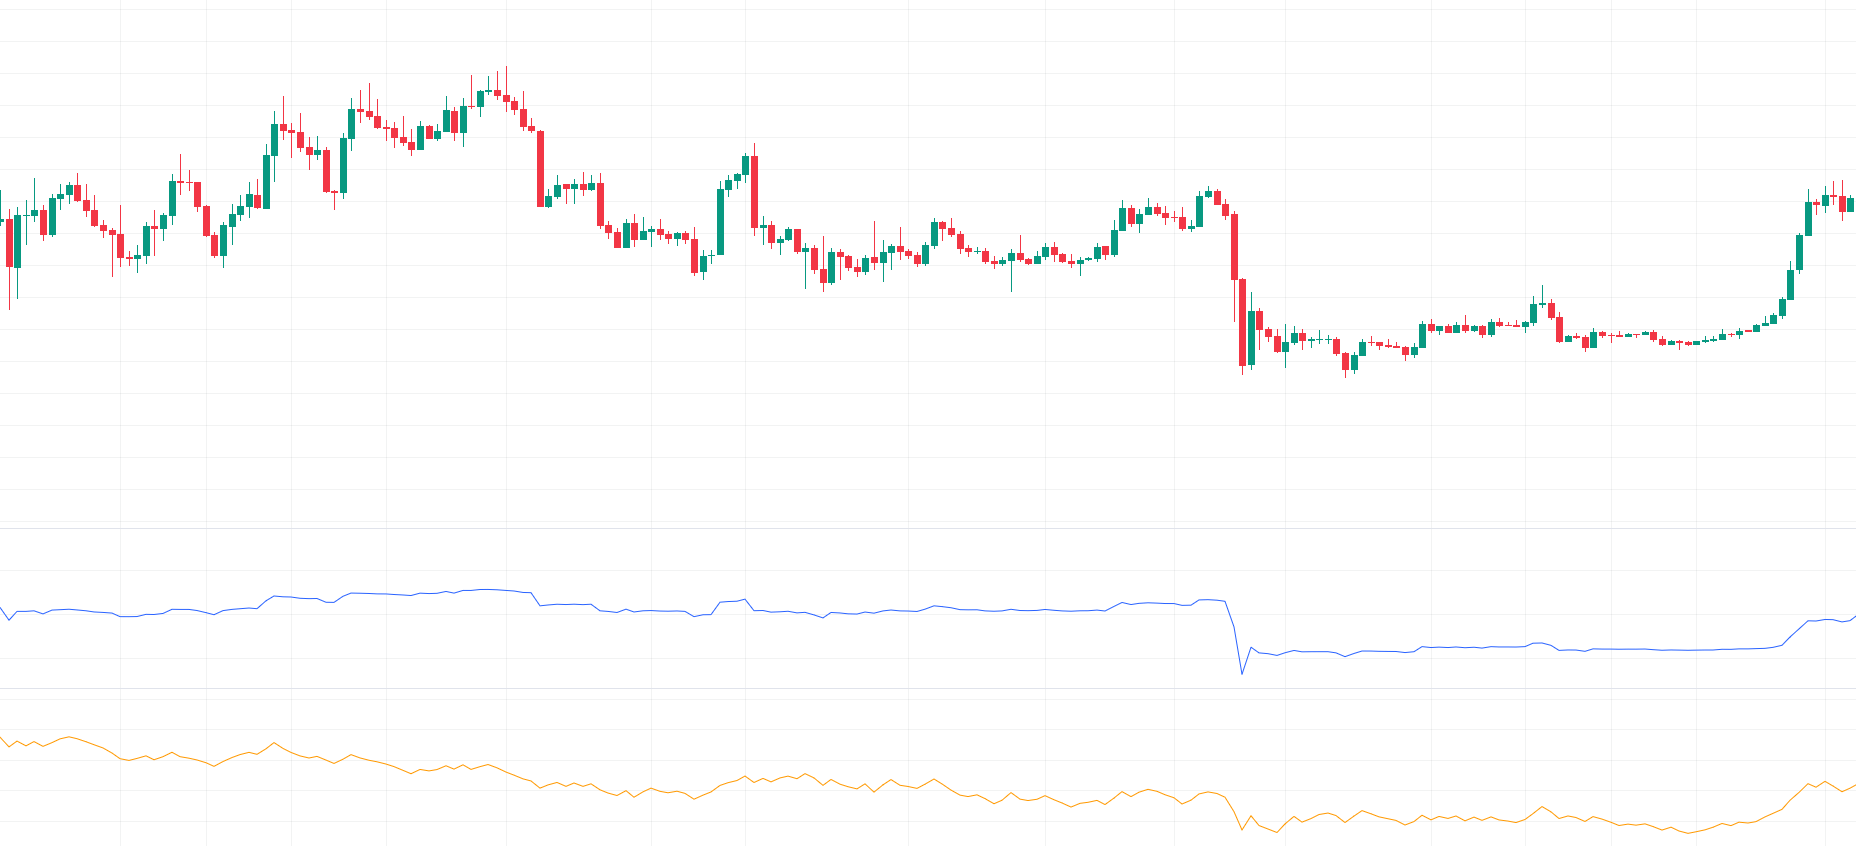
Volume serves as a quantitative measure of the traded shares within a specific timeframe, offering insights into the activity and liquidity of a security.
Volume indicators encompass tools that incorporate historical volume data into their calculations. However, it's important to note that not all indicators that use volume in their calculations fall under this category. Examples like the volume weighted moving average (VWMA) or money flow index (MFI) don't qualify as volume indicators. These indicators can be categorized as either lagging or leading, depending on their design.
Various Volume Indicators
While the selection of volume indicators is smaller compared to trend or momentum indicators, some have gained significant popularity. For instance, the price volume trend indicator (PVT) calculates the cumulative sum of price changes weighted by current volume. This approach offers an alternative view of price movement by filtering out variations with low volume.
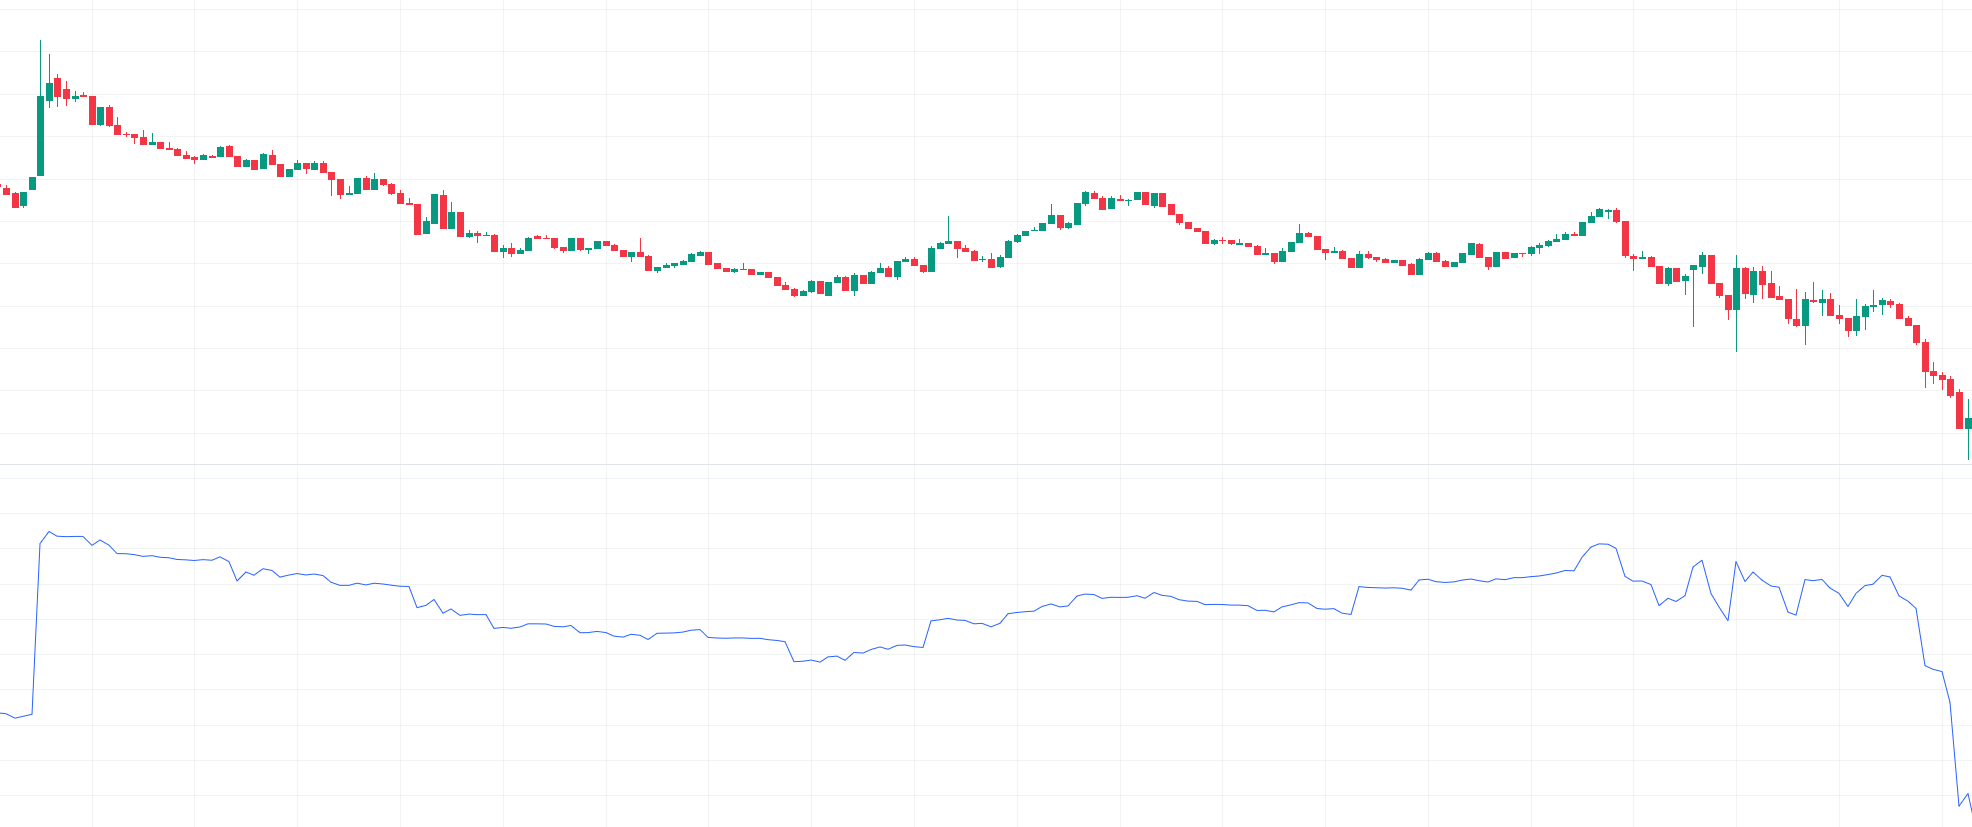
A similar indicator is the on balance volume (OBV), which shares a calculation method with PVT but factors in the direction of price changes.
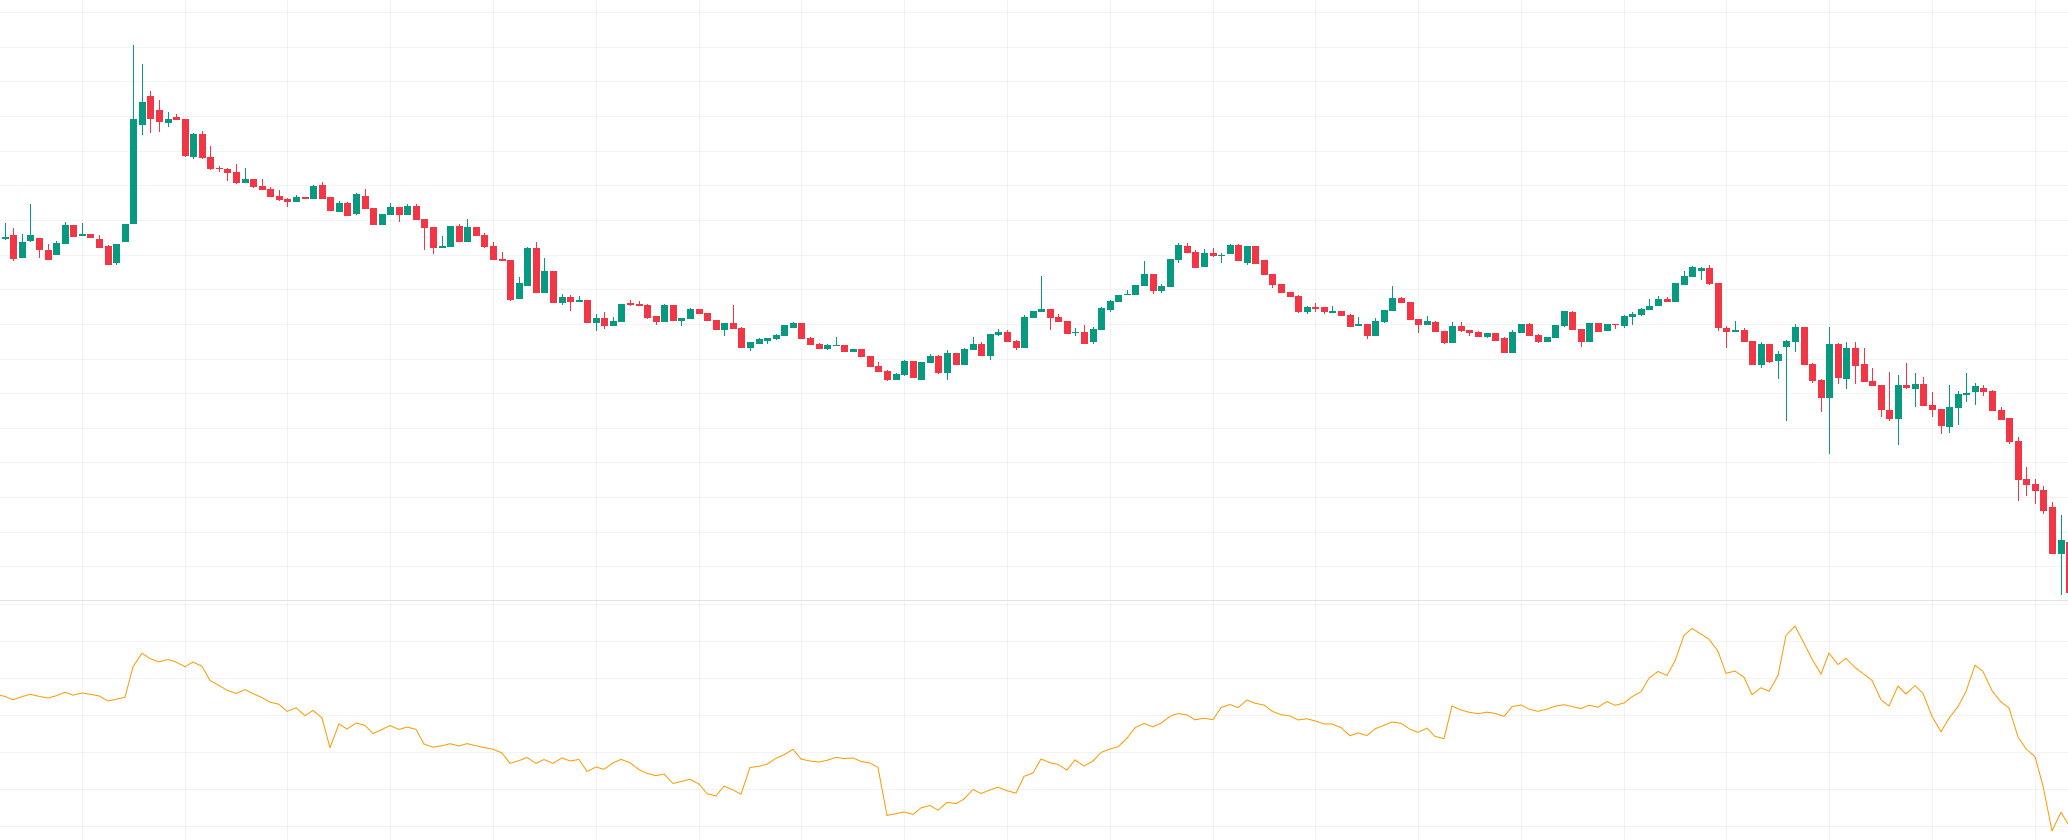
Additional volume indicators encompass the accumulation/distribution index, ease of movement, and Elder force index, among others.
Volume Profile
The volume profile serves as a valuable tool displaying the distribution of volume across different price levels.
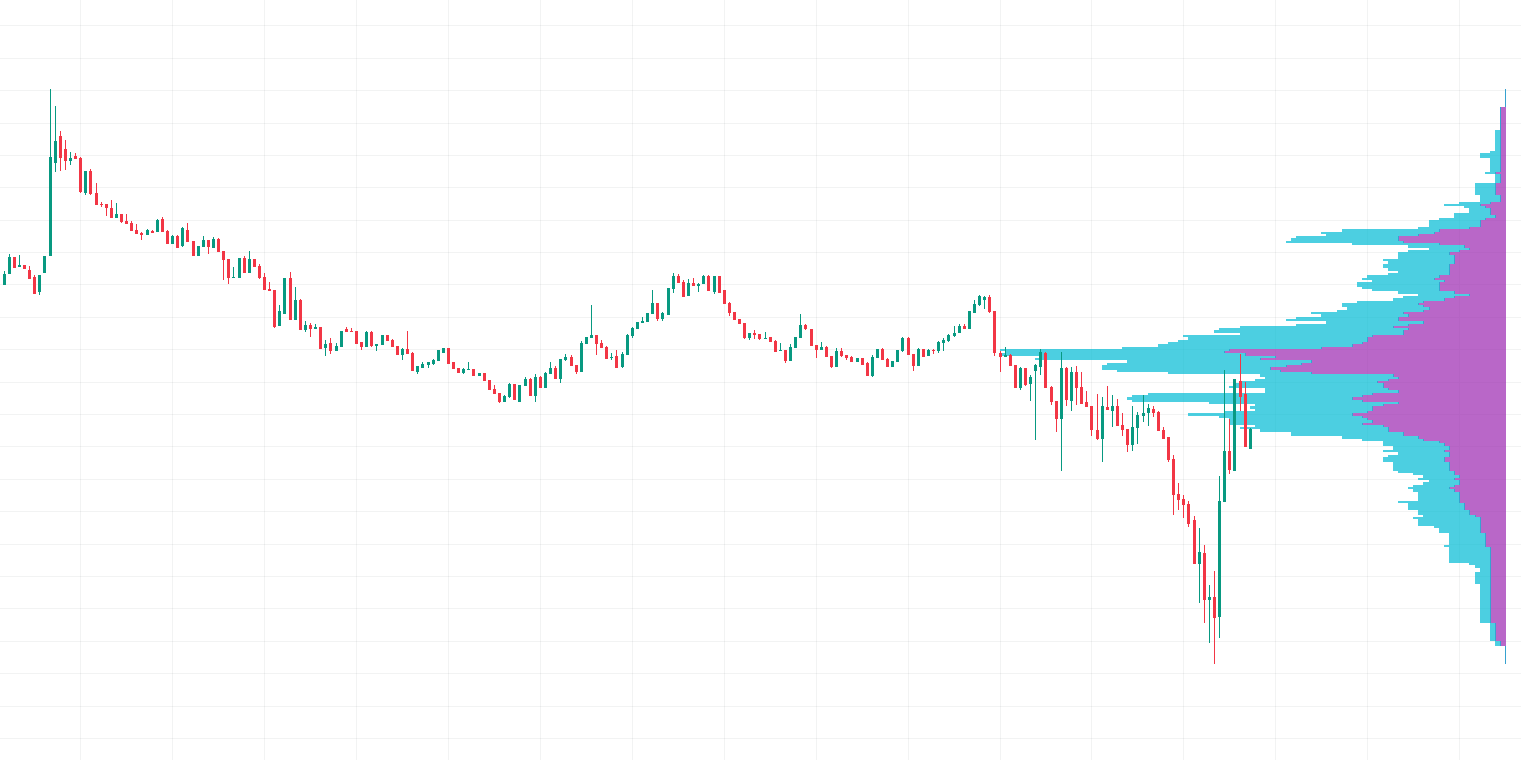
The point of control is denoted by the red line, representing the price level that has accumulated the highest volume. This line is often observed in regions where the price remains relatively stable