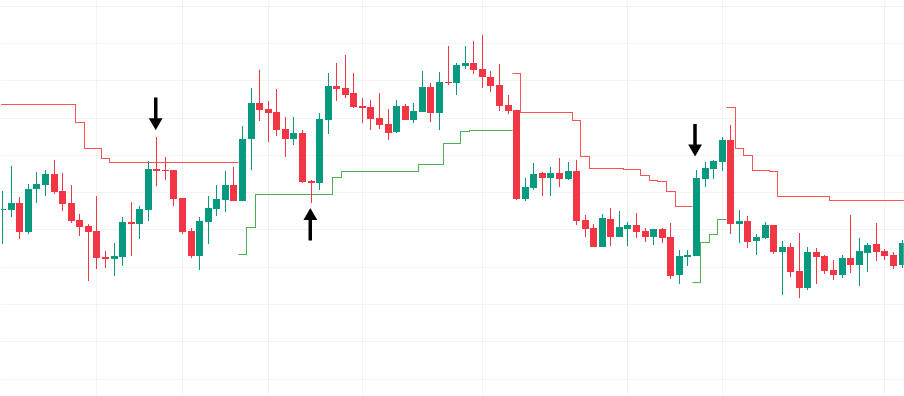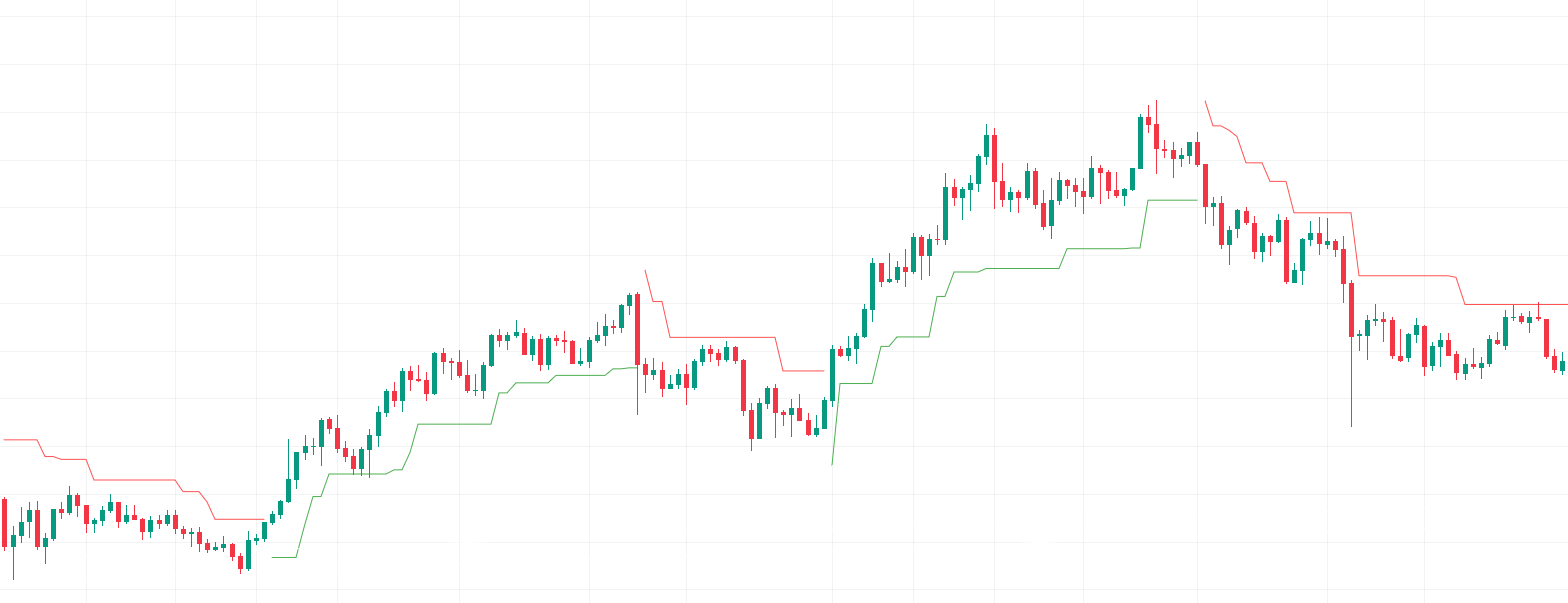
Trend indicators provide insights into the prevailing trend within price movements. Some specifically estimate the primary trend component, while others focus on indicating its trajectory. Most of these indicators are categorized as lagging and are usually overlayed on the main price chart.
Moving Averages
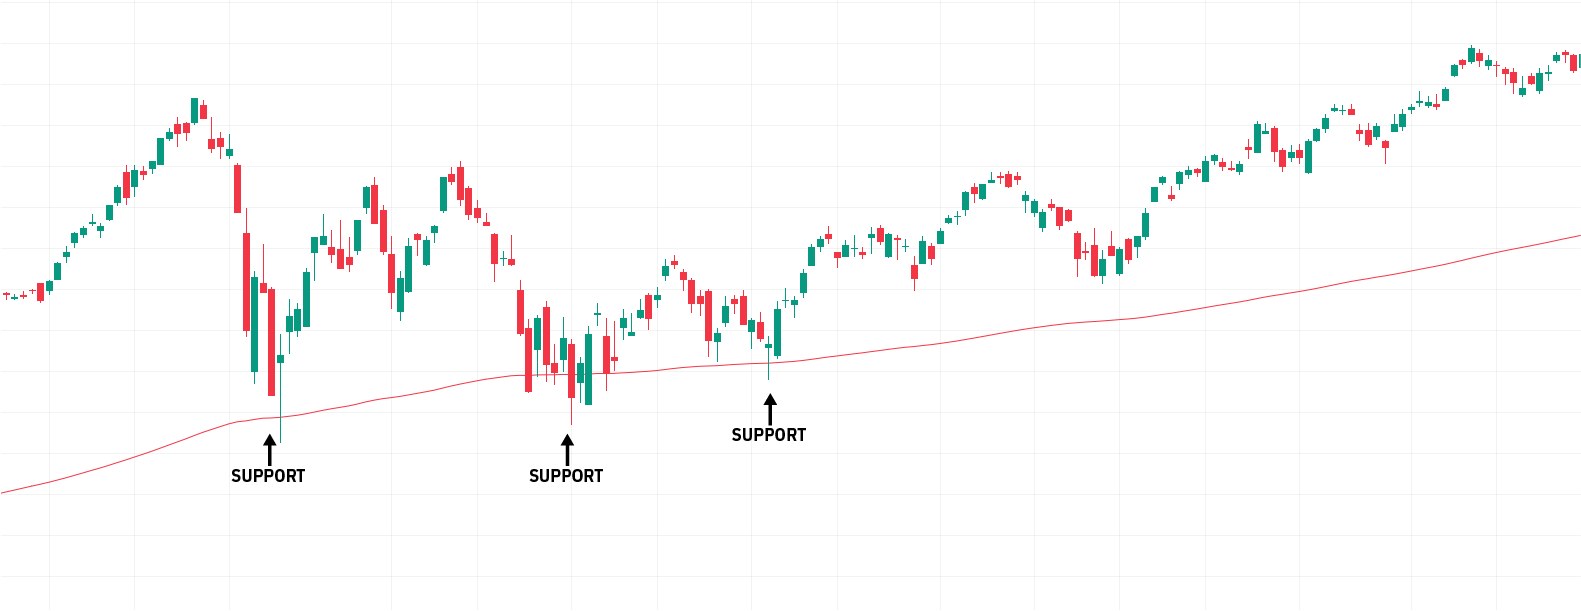
Acting as lagging trend tools, moving averages smooth out the closing price by filtering out certain fluctuations, offering an estimation of the predominant trend in the price. They're staples in technical analysis, making their presence felt in nearly every analytical software.
Each moving average comes with a setting that dictates its smoothness level. This setting is typically referred to as its "length", "period", or sometimes "window".
Notable Moving Averages
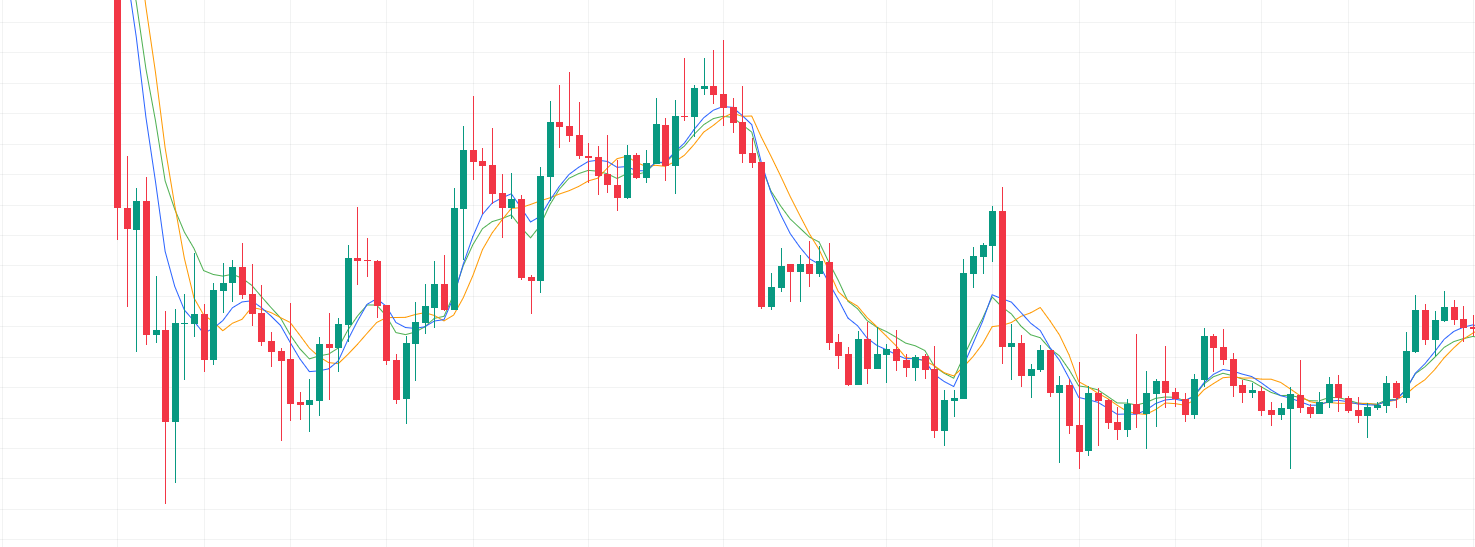
The simple moving average, often known as "SMA", stands out for its straightforward computation.
The exponential moving average (EMA) is another key player, offering quicker responsiveness than the SMA.
Another notable mention is the weighted moving average (WMA), which emphasizes recent prices more heavily, resulting in even less lag than the EMA.
Calculation for each of these moving averages are given below:
- SMA
- EMA
- WMA
where denote the period of the SMA and the closing price.
with , where denote the period of the EMA and the closing price. The EMA is generally initialised using a SMA of the same period.
where denote the period of the WMA and the closing price.
Applications
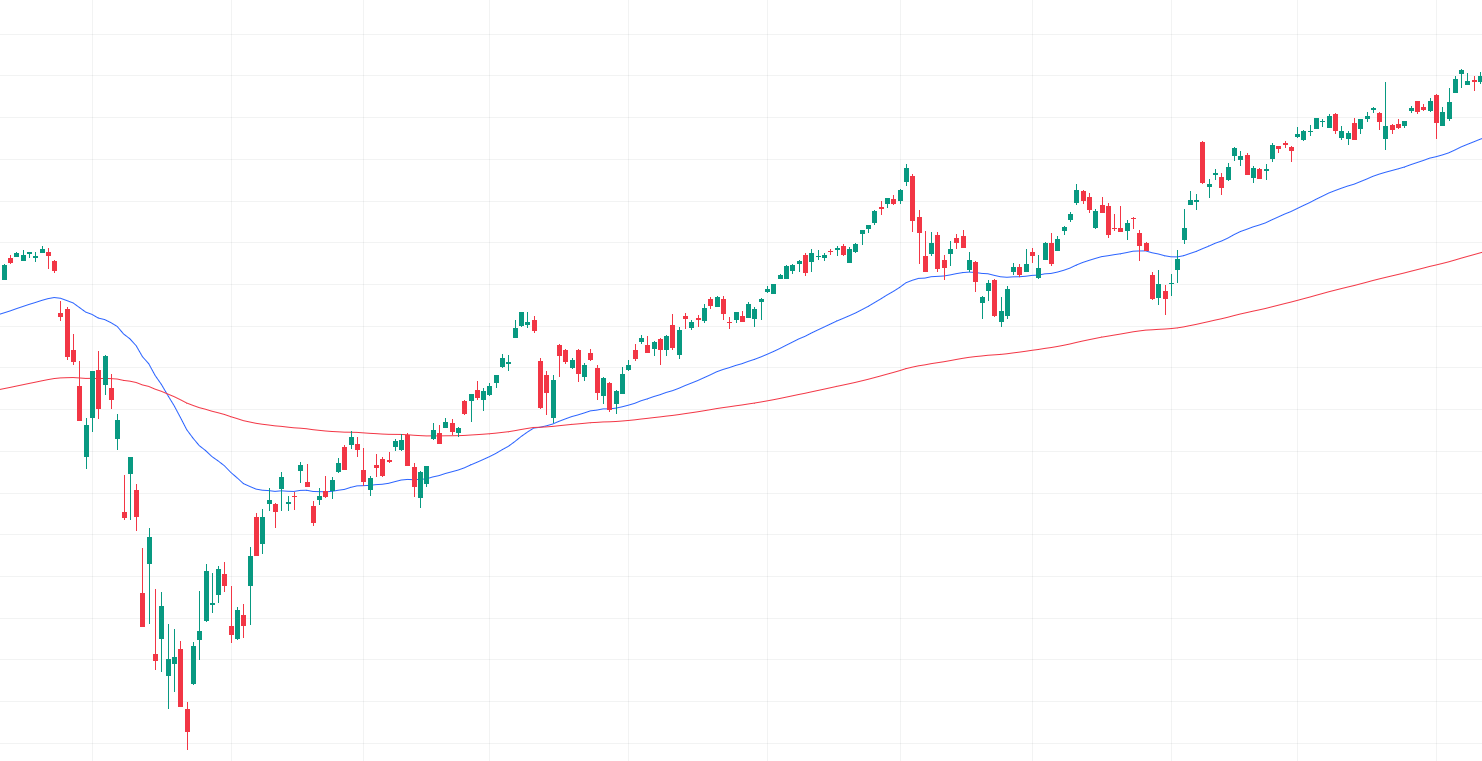
Traders often discern the prevailing price trend direction by examining intersections between the price and moving average or between short-term and long-term moving averages.
Additionally, moving averages serve as dynamic support and resistance levels – initiating purchases when an ascending price touches the moving average and selling when a descending price does the same.
Bands/Channel Indicators
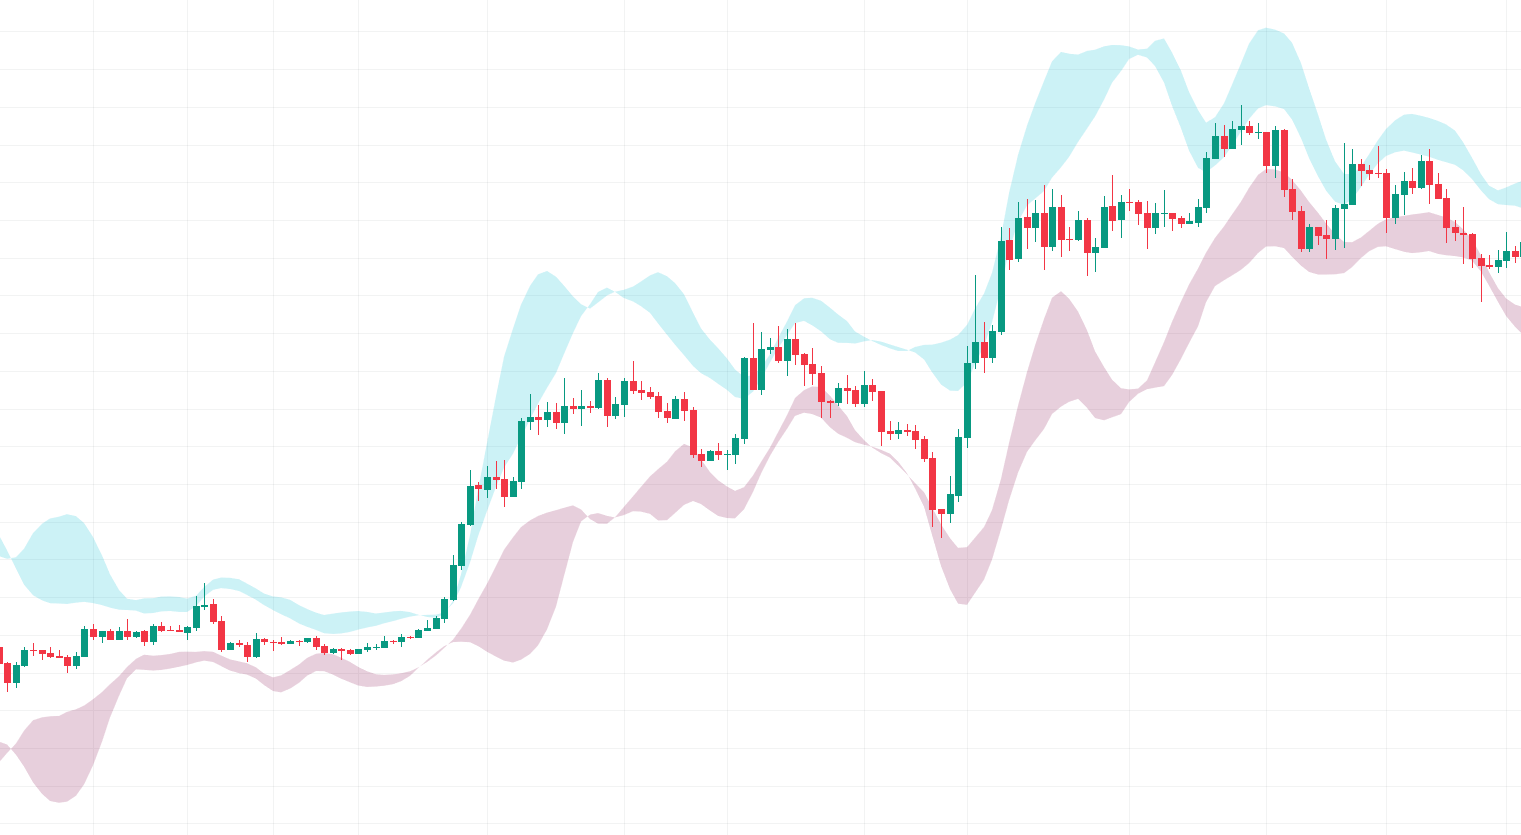
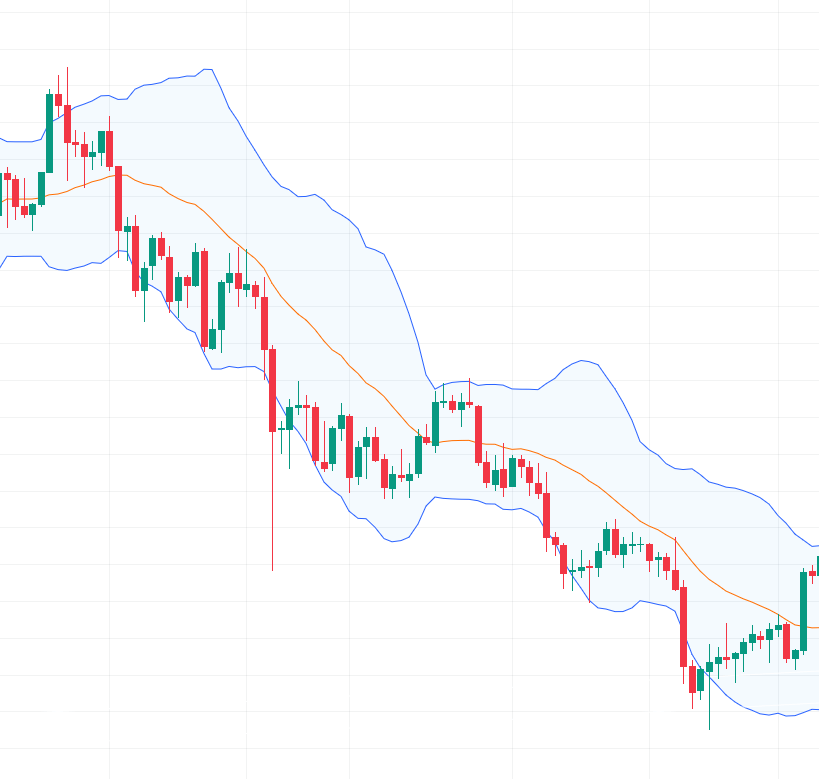
Such trend indicators introduce an upper and a lower boundary on the price graph, usually deriving from moving averages combined with volatility metrics.
Prominent Band Indicators
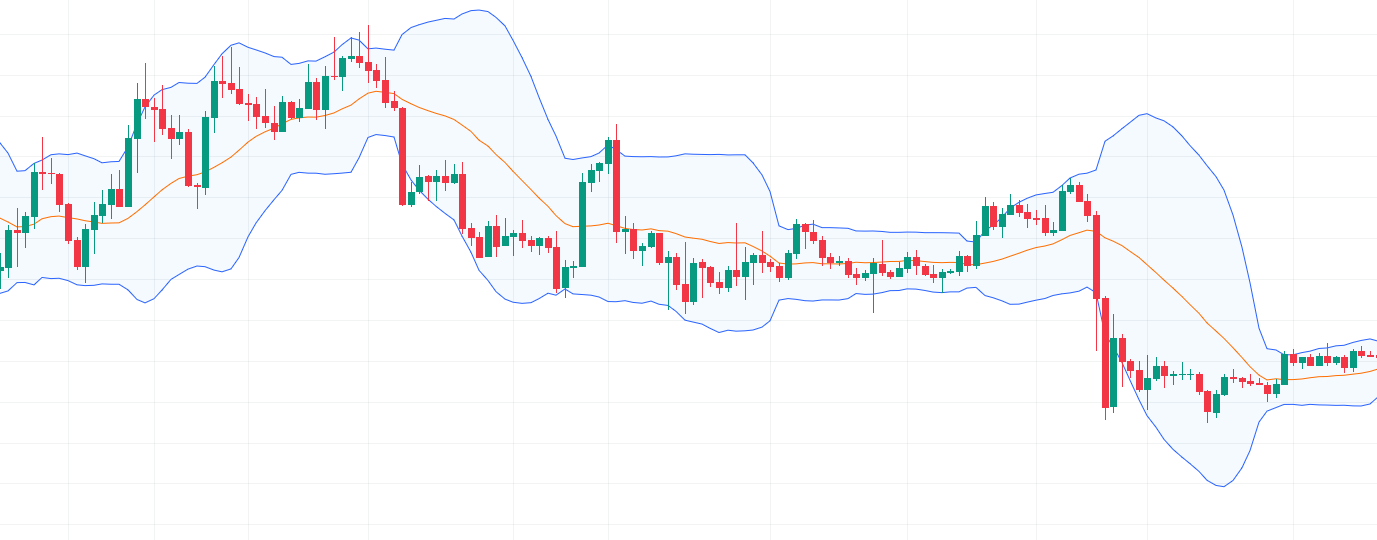
The Bollinger bands, introduced by John Bollinger, are perhaps the most recognizable. They're computed by adding or subtracting a rolling standard deviation from an SMA.
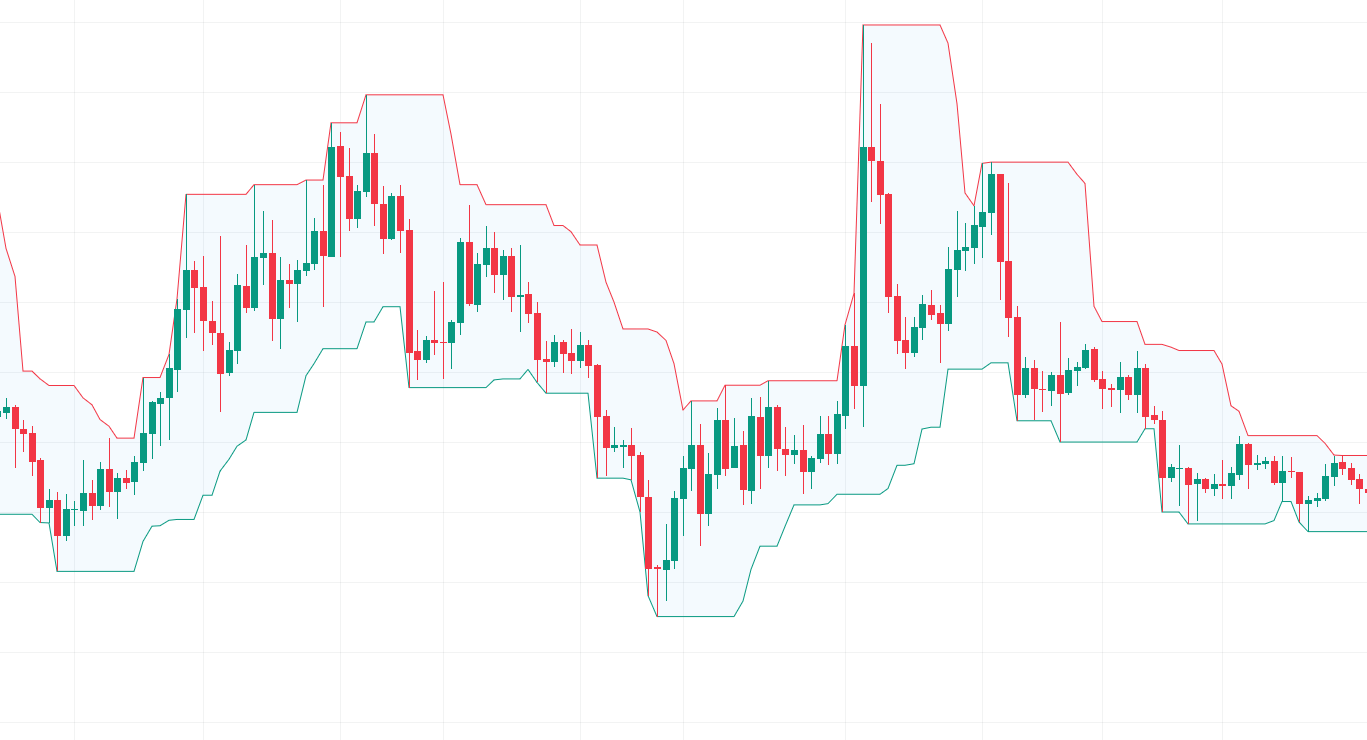
The Donchian channel, crafted by Richard Donchian, is another prevalent choice. It sets its top boundary using a rolling high price peak and its bottom boundary using a rolling low price trough.
Usage
The boundaries rendered by band indicators often act as support and resistance zones, especially in sideways markets.
Additionally, they can help discern trend direction via breakout techniques: an uptrend is suggested when prices breach the upper boundary, and a downtrend upon crossing below the lower boundary.
Trailing Stops
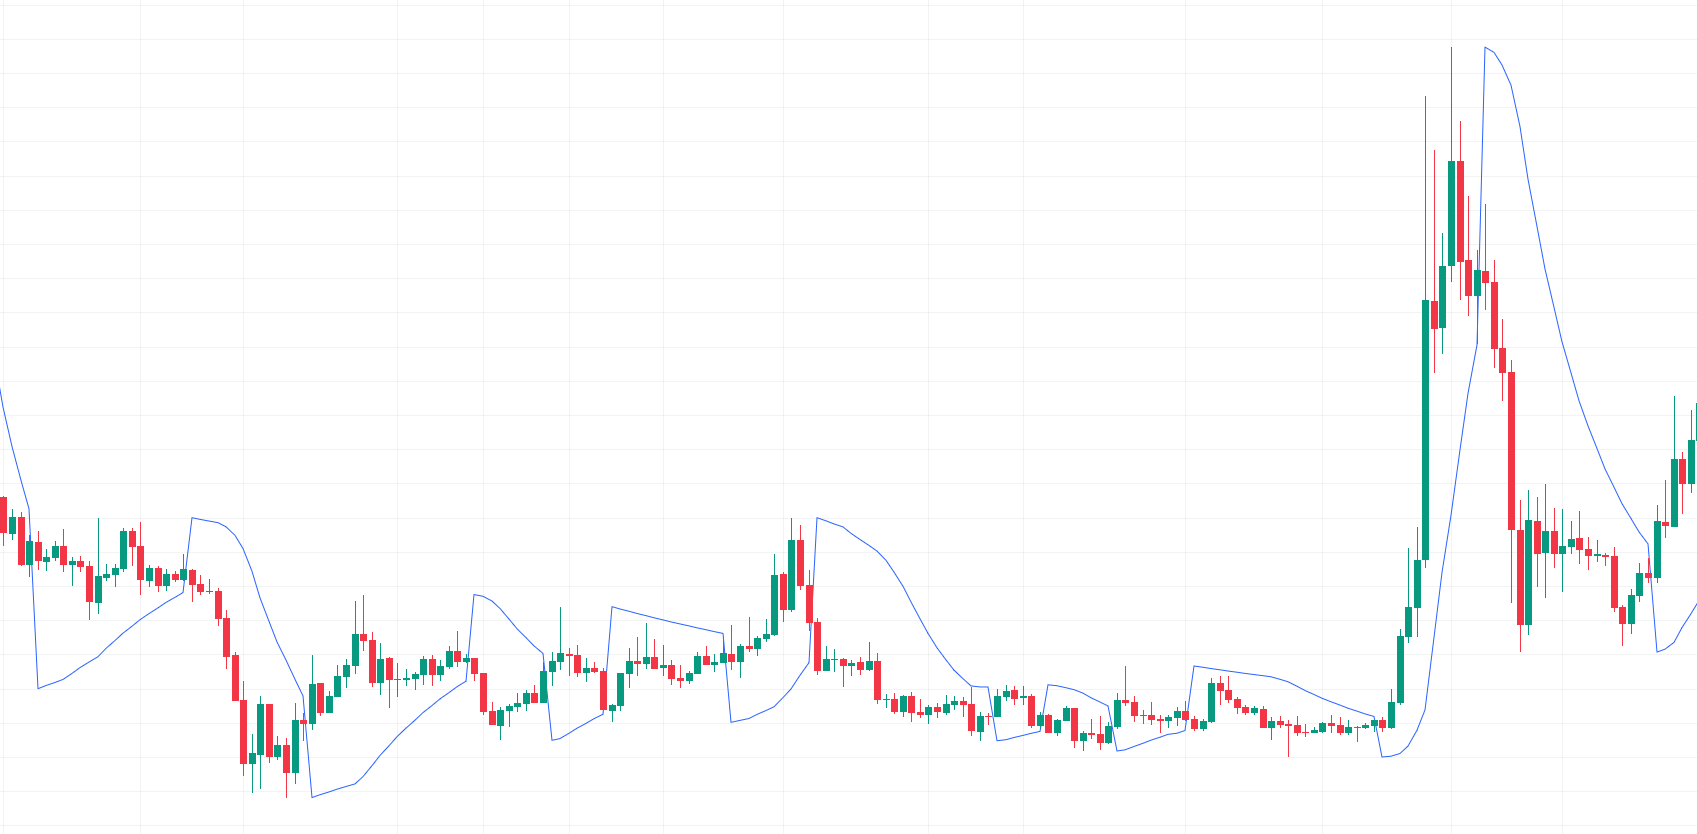
These are pivotal in identifying ongoing price trends and can double up as dynamic stop loss points or as rolling support/resistance zones.
Renowned Trailing Stops
Among the various trailing stops available, the Supertrend, a creation of Olivier Seban, is perhaps the most notable.
The parabolic stop and reverse (often denoted as PSAR or simply SAR), introduced by Wells Wilder, is another key trailing stop.
Applications / Usage
Interpreting trailing stops is usually straightforward: an uptrend is signaled when prices are above the stop, and a downtrend when below. Like moving averages, they can also function as evolving support and resistance markers.