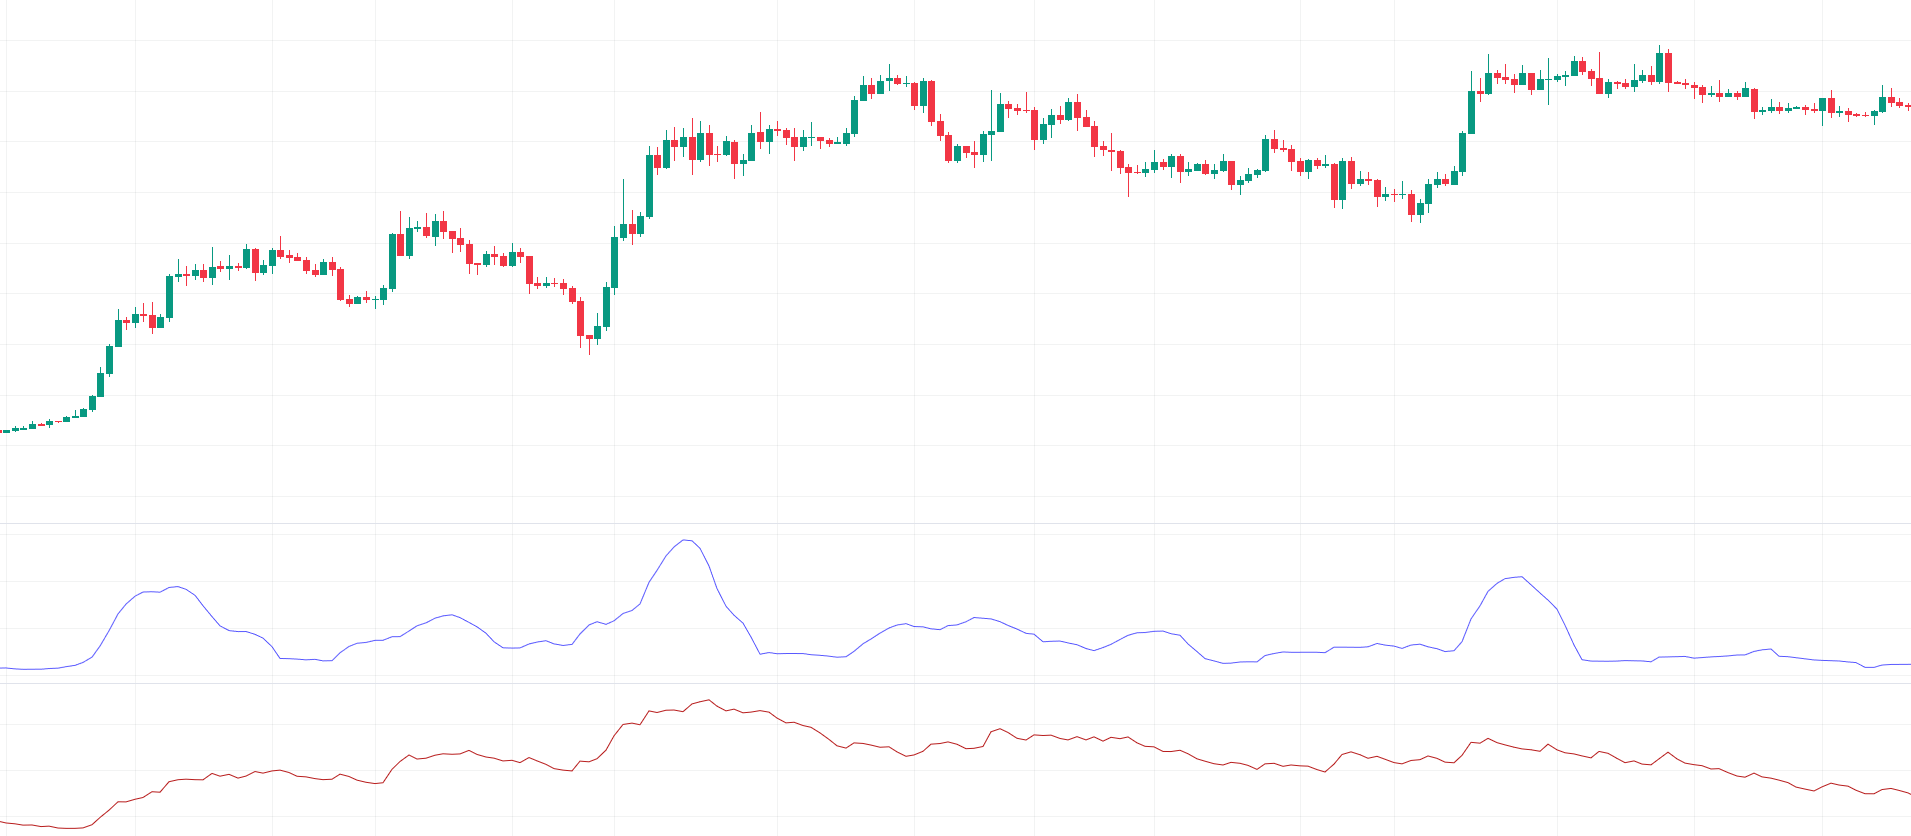
Volatility indicators gauge the intensity of price fluctuations, offering insights into the magnitude of price variations rather than their direction. Thus, they play a pivotal role in risk assessment, allowing traders to tailor their positions to their risk tolerance. Typically, volatility indicators fall under the category of lagging indicators.
Though not frequently found pre-applied on trading charts, many renowned technical indicators like the Bollinger Bands or Supertrend incorporate elements of volatility measurement.
Key Volatility Indicators
Among the most recognized volatility indicators are the rolling standard deviation (often referred to as STDEV) and the average true range (ATR), a creation of Wilder.
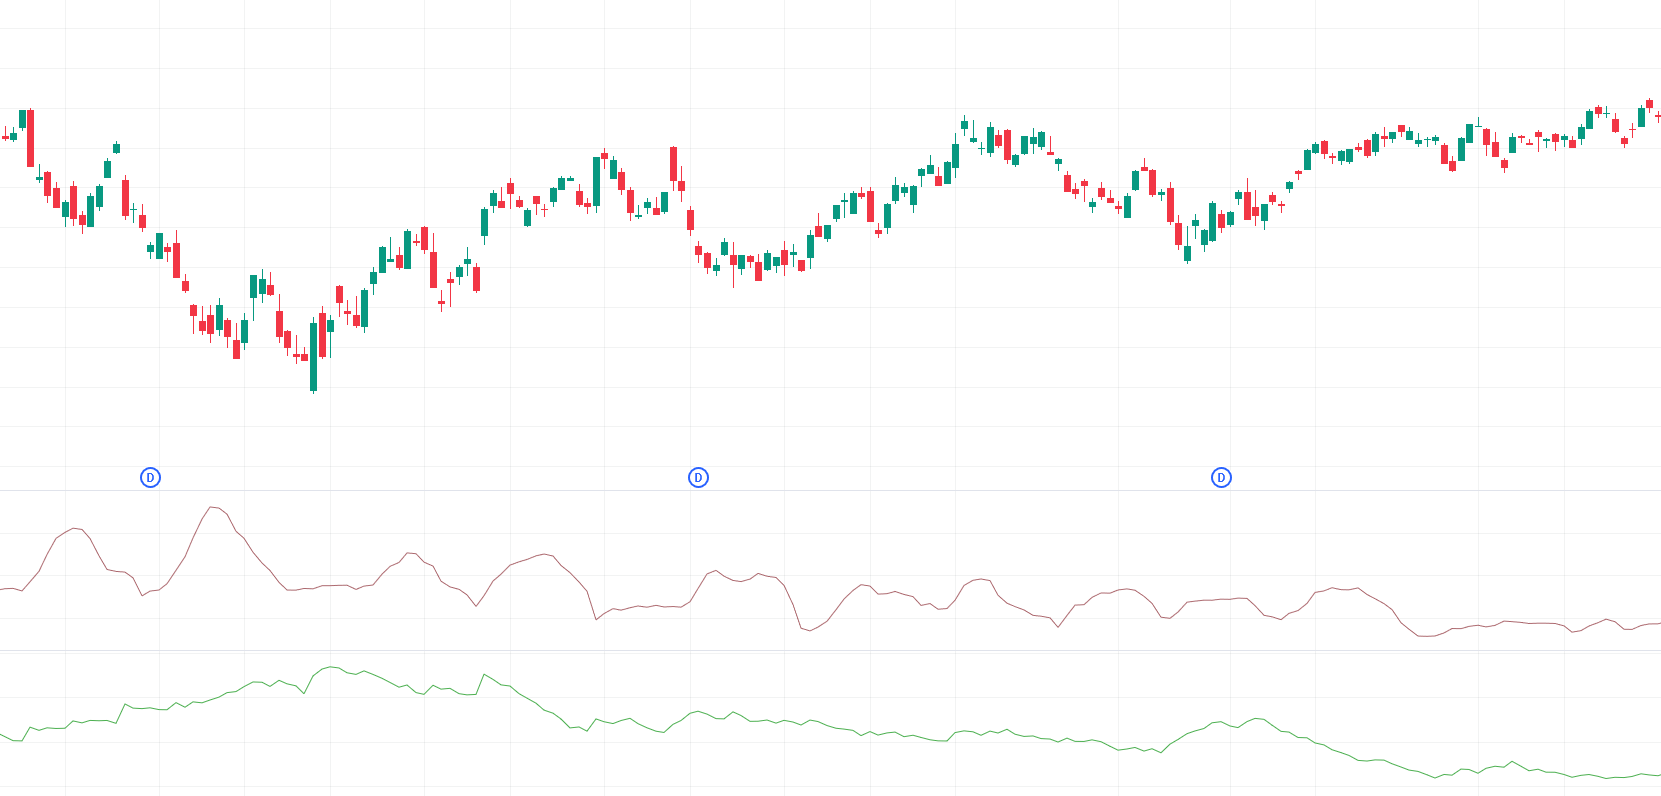
While some traders prefer using the standard deviation of price shifts to determine volatility, others lean towards the standard deviation of closing prices.